FAM149A
Family with sequence similarity 149, member A is a protein that in humans is encoded by the FAM149A gene (also known as MSTP119, MST119 and DKFZP564J102).[5] It is well conserved in primates, dog, cow, mouse, rat, and chicken. It has one paralog, FAM149B.
| FAM149A | |||||||||||||||||||||||||
|---|---|---|---|---|---|---|---|---|---|---|---|---|---|---|---|---|---|---|---|---|---|---|---|---|---|
| Identifiers | |||||||||||||||||||||||||
| Aliases | FAM149A, MSTP119, MST119, family with sequence similarity 149 member A | ||||||||||||||||||||||||
| External IDs | MGI: 2387177 HomoloGene: 27540 GeneCards: FAM149A | ||||||||||||||||||||||||
| |||||||||||||||||||||||||
| |||||||||||||||||||||||||
| Orthologs | |||||||||||||||||||||||||
| Species | Human | Mouse | |||||||||||||||||||||||
| Entrez | |||||||||||||||||||||||||
| Ensembl | |||||||||||||||||||||||||
| UniProt | |||||||||||||||||||||||||
| RefSeq (mRNA) | |||||||||||||||||||||||||
| RefSeq (protein) | |||||||||||||||||||||||||
| Location (UCSC) | Chr 4: 186.1 – 186.17 Mb | Chr 8: 45.34 – 45.38 Mb | |||||||||||||||||||||||
| PubMed search | [3] | [4] | |||||||||||||||||||||||
| Wikidata | |||||||||||||||||||||||||
| |||||||||||||||||||||||||
Overview
FAM149A is found in normal cardiac tissue of Homo sapiens and has been submitted to the Molecular Medicine Center for Cardiovascular Disease in 1999. Thus, this indicates it must play an important role in normal heart regulation. However, no variation report or information of clinical significance has been found for this gene, according to NCBI. According to the Basic Local Alignment Search Tool (BLAST), FAM149A is similar to cDNA FLJ32604 (98% query cover), which is found in stomach tissue and has no known function. FAM149A is also similar to cDNA FLJ58677 (86% query cover), which is found in fetal kidney tissue with no known function.
Information acquired from:
https://www.ncbi.nlm.nih.gov/
Gene
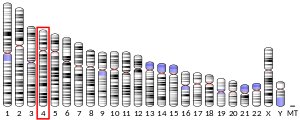
FAM149A consists of 2721 base pairs and 482 amino acids and is located on chromosome 4q35.1. It runs on the positive strand of chromosome 4. Other genes are also found nearby on the same chromosome, including TLR3, CYP4V2, FLJ38576, ORAOV1P1, and SORBS2.[6]

Homology/evolution
Paralogs and orthologs
FAM149A possess one major paralog, FAM149B. Not much is currently known about FAM149B besides its membership in the overall FAM149 family of genes.
Orthologs of FAM149A include BRTD and its four isoforms, ECCHC11 and ALMS1. These genes are all found in humans and have conserved areas with FAM149A.
| Species | Common name | Accession number | Length | Protein identity | Protein similarity | Date of divergence (millions of years) | |
|---|---|---|---|---|---|---|---|
| Homo sapiens | Human | NP_001073963.1 | 482aa | 100% | 100% | 0 | |
| Pongo abelii | Orangutan | XP_002815398.2 | 481aa | 93.2% | 95.0% | 15.7 | |
| Nomascus leucogenys | Northern white-cheeked gibbon | XP_004093218.1 | 482aa | 92.7% | 95.0% | 20.4 | |
| Equus ferus caballus | Horse | XP_001490414.3 | 480aa | 72.0% | 81.0% | 94.2 | |
| Taeniopygia guttata | Zebra finch | XP_002193183 | 485aa | 46.0% | 62.0% | 296 | |
| Monodelphis domestica | Opossum | XP_001368447.2 | 1133aa | 19.5% | 61.0% | 162.6 | |
| Xenopus tropicalis | Western clawed frog | XP_002934449 | 427aa | 22.0% | 65.0% | 371.2 | |
Conserved domain
FAM149A has a conserved domain of unknown function (DUF) 3719. The DUF 3719 has very little information. It is only found in eukaryotic organisms and is made of 70 amino acids. There is a conserved HLR sequence motif found in DUF 3719. Below is an image showing the DUF3719 on FAM149A.

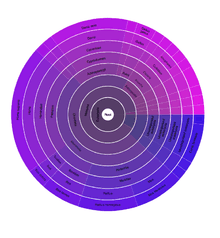
From the Sanger Institute, the following image shows the species in which this family exists in. The purple color indicates that DUF3719 is only existent in eukaryotic organisms. Colors, such as green, would indicate that DUF3719 exists in bacteria. When this diagram is used interactively on the website, it states that 23 species in Eukaryota have the domain.[7]
Phylogeny
FAM149A diverged from amphibians around 400 million years ago, birds 300 million years ago and mammals, not including primates, 94 million years ago. Divergence from primates last occurred around 5 million years ago.[8]
Protein
Primary sequence
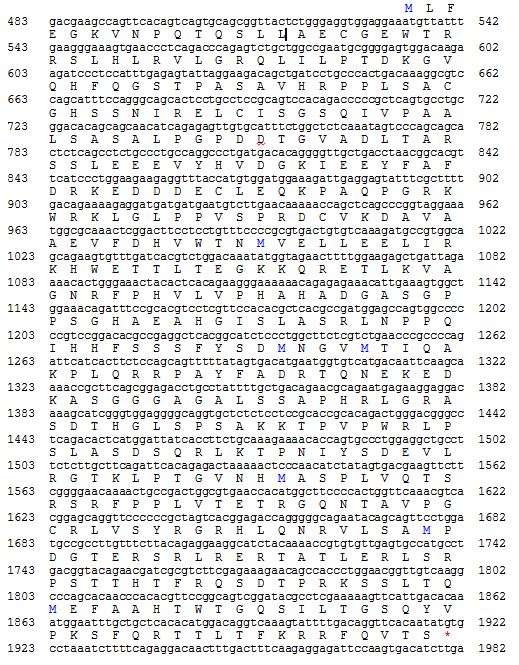
As previously stated, FAM149A is made up of 482 amino acids. The amino acids which play a part in the translation of the FAM149A gene into the FAM149A protein are shown below, along with matching base pairs. The protein is located between bp 534 and bp 1982.
Post-translational modifications
There are some programs used to determine post-translational modifications in FAM149A.[9] The tests and results for each are listed below.
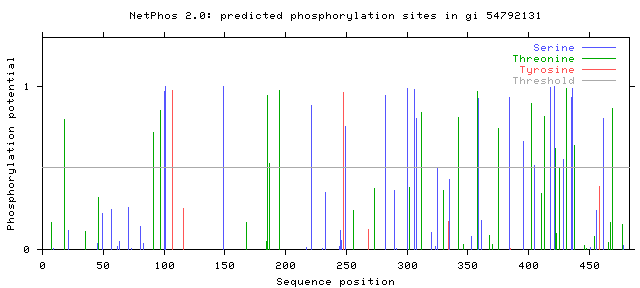
NetPhos: This will provide predicted phosphorylation sites within your protein, occurring on serines, tyrosines, and threonines. Scores are provided that indicate the quality of the predicted site. A “good” score is closer to 1.0, while a low score is closer to zero. Results: Phosphorylation sites predicted: Ser: 20 Thr: 16 Tyr: 2 All of these predicted sites had scores above 0.514, most between 0.8-0.9. Image generated:
Sulfinator: This is used to predict tyrosine sulfation sites made as proteins go through secretory pathway. There were no results for FAM149A. Therefore, there aren't any tyrosine sulfation sites.
NetAcet: Predicts N-terminal acetylation sites.
Here are the results:

According to NetAcet, there are no N-terminal acetylation sites for FAM149A.
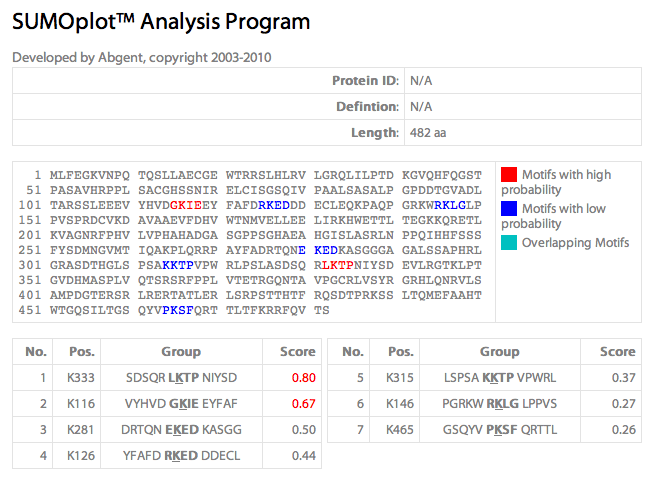
SUMOplot/SUMOsp: Used to predict potential sumoylation sites. These may explain larger molecular weights than expected on SDS gels due to attachment of SUMO proteins.
The results can be seen below:
Secondary structure
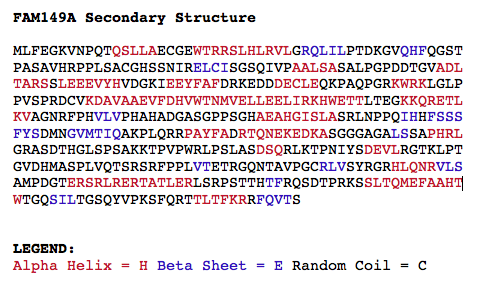
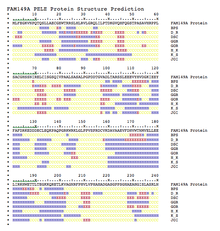
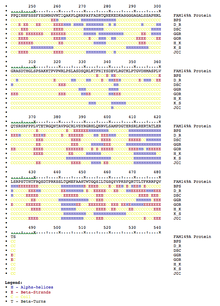
The secondary structure of the FAM149A protein is based on a local three-dimensional structure. The structures analyzed include the α-helix, β-strand, β-turn, and random coil. Results were obtained using GOR4 and PELE[10] from Biology WorkBench. GOR4 is a simplified version, and PELE compares predicted structures from other programs.
 |
 FAM149A secondary structure from PELE via Biology WorkBench 1. |
 FAM149A secondary structure from PELE via Biology WorkBench 2. |
Expression
Promoter
Here is the promoter for the FAM149A gene provided by ElDorado[11] and the sequence extracted from the information.
| Segment | Start Location | Stop Location | Strand | Length | Reference Number | Information |
|---|---|---|---|---|---|---|
| Promoter Region | 187065495 | 187066181 | + | 687 bp | GXP_210035 | Promoter for GXT_23739713, GXT_23739714, GXT_2803949
Locus: FAM149A/GXL_175098 |
| Primary Transcript | 187065995 | 187093817 | + | 27283 bp | GXT_2803949, GXL_175098 | FAM149A
Homo sapiens family with sequence similarity 149, member A (FAM149A), transcript variant 1, mRNA. GeneID:25854/NM_015398 |
The following is a FASTA formatted version of the FAM149A promoter.
.png)
Conservation of gene structure across species
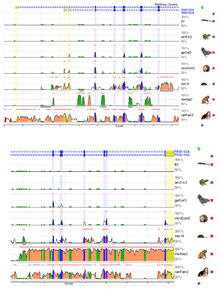
Through the NCBI website, an additional 1000 basepairs were added to the selected region on chromosome 4 containing FAM149A. Once the start and end positions were established, the positions were transferred to the ECR Browser to create an alignment across other species.
According to the results, there are 14 exons within FAM149A, which are conserved in the monkey, dog, mouse, and opossum. The chicken, frog, and fish show little to no conservation. Within the first 1000 base pairs prior to the start of the transcription, there appears to be no notable conservation across species. Only the dog contains what is considered as an Evolutionary Conserved Region (ECR).[12]
Expression
Based on the graphs on the right, the highest levels of expression occur in the trigeminal ganglion, superior cervical ganglion, atrioventricular node (heart), and kidney. However, at least a small amount seems to be expressed in almost all tissues in the human body. Using the same micro arrays provided by Bio GPS,[13] expression of FAM149A was found to vary through the shedding of the endometrium during menstruation. This opens a new avenue for possible exploration of the function of the gene.
 FAM149A Expression 1 |
 FAM149A Expression 2 |
 FAM149A Expression 3 |
A search was performed on the Allen Brain Atlas using FAM149A. According to the levels of expression provided by the Atlas, FAM149A is not expressed in notable levels within the mouse brain. However, with visual observation of the figure, FAM149A could be found in the ventral posterior complex of the thalamus. This can be seen as the dark vertical line in the center of the sagittal brain slice in the image below. As a comparison, the expression of the protein, actin, is used to demonstrate what a mouse brain appears like with high levels of expression.[14]
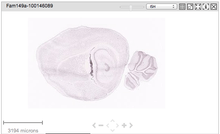 FAM149A protein expression in mouse brain. |
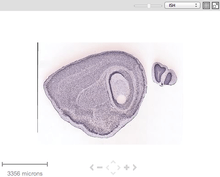 Example of Actin Beta protein expression in mouse brain. |
FAM149A protein levels of expression in mouse brain. |
Example of Actin Beta protein levels of expression in mouse brain. |
EST profile
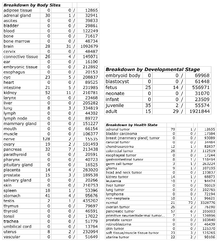
The data from the figure below indicates that FAM149A is highly expressed in the brain, nerves, pancreas, adrenal gland, and kidney. There is no expression in the heart. From the information in the second table, common complications involving FAM149A expression include adrenal tumors, pancreatic tumors, colorectal tumors, and ovarian tumors.[15]
Transcription variants
FAM149A has two transcription variants, transcript variant 1 and transcript variant 2. Both code for the same FAM149A protein. Differences include additional base pairs in the 5' untranslated area as well as the 3' untranslated region. One of two differences in the actual translated area of the protein is a G instead of an A at bp 1590 in Variant 1 and bp 1337 in Variant 2. The other difference consists of a C instead of an A at bp 2214 in TV1 and bp 1961 in TV2.
Composition
As stated above, FAM149A is made up of 482 amino acids. The most common amino acid is serine which makes up 9.8% of the gene. The least common amino acids are tryptophan and cysteine which each make up only 1.2% of the gene. The only recurring combination of amino acids in the protein is SLAS which occurs from amino acids 234-237 and from 324–327. In addition, the Isoelectric Point of FAM149A is 9.891999[16]
Interacting proteins
Transcription factor binding sites
The following is an analysis of the promoter region for FAM149A. It shows a number of transcription factor binding sites that may have strong contribution to regulating the genetic expression. The image below shows the locations of the binding sites. The binding sites were analyzed to find any possible unique functions.

There were many results, but the ones with the highest similarity and highest abundance were chosen, as they are most likely to be present on the actual gene. Matrix families of interest include the Huntington's disease gene regulatory region, nerve growth factor, nuclear respiratory factor, pleomorphic adenoma gene, zinc finger transcription factors, and an E2F-myc activator/cell cycle regulator. Many of them had interactions revolving the zinc finger complex, which suggests this may be important for FAM149A.[17]
Protein interactions
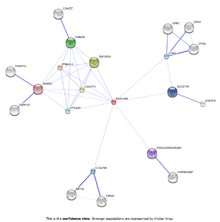
FAM149A has potential interactions with ZNF385D, C10orf10, PNMAL1, CPN2, C10orf72, VPS13D, and RBMS3.[18] Based on previous research on binding sites, many were frequently involved with zinc finger proteins. According to the results from STRING, the second strongest associating protein is zinc finger protein 385D. However, it cannot be concluded these are the only interacting proteins, as it seems there is little to not research involving FAM149A interactions. The Molecular Interaction Database (MINT) was used as an additional source for protein interactions. However, FAM149A was not in the database. Based on the list of functional partners by STRING, the top 5 are also not in the MINT database. Another interaction database, I2D Protein-Protein Interaction[19] showed possible interaction with the Protein PRKAG1, however interaction was weak.
Below is the list of proteins that potentially interact with FAM149A.

Clinical significance
Disease association
While not conclusively linked, FAM149A has been found to be one of 15 candidate genes for the contribution of development of cancer and dysplastic lesions.[20] The same paper also noted the down regulation of the gene during oral cancer, providing a possible route of study.
References
- GRCh38: Ensembl release 89: ENSG00000109794 - Ensembl, May 2017
- GRCm38: Ensembl release 89: ENSMUSG00000070044 - Ensembl, May 2017
- "Human PubMed Reference:". National Center for Biotechnology Information, U.S. National Library of Medicine.
- "Mouse PubMed Reference:". National Center for Biotechnology Information, U.S. National Library of Medicine.
- Xu X, Tsumagari K, Sowden J, Tawil R, Boyle AP, Song L, Furey TS, Crawford GE, Ehrlich M (December 2009). "DNaseI hypersensitivity at gene-poor, FSH dystrophy-linked 4q35.2". Nucleic Acids Res. 37 (22): 7381–93. doi:10.1093/nar/gkp833. PMC 2794184. PMID 19820107.
- "FAM149A, family with sequence similarity 149, member A [Homo sapiens (Human)]". Gene - NCBI.
- "DUF3719". Species Distribution from Sanger Institute. Archived from the original on 2011-05-06.
- "Clustal W". San Diego Super Computer Center. Retrieved 5 March 2013.
- "ExPASy: SIB Bioinformatics Resource Portal - Categories". SIB Swiss Institute of Bioinformatics.
- "FAM149A Secondary Structure". GOR4 and PELE - Biology WorkBench.
- "ElDorado". Genomatix. Retrieved 30 April 2013.
- Ovcharenko I, Nobrega MA, Loots GG, Stubbs L (July 2004). "ECR Browser: a tool for visualizing and accessing data from comparisons of multiple vertebrate genomes". Nucleic Acids Res. 32 (Web Server issue): W280–6. doi:10.1093/nar/gkh355. PMC 441493. PMID 15215395.
- "BioGPS". Retrieved 2013-05-14.
- "FAM149A Expression". Allen Brain Atlas.
- "FAM149A EST Profile". EST Profile from UniGene via NCBI.
- "PI". Biology Workbench. San Diego Supercomputer Center.
- "GEMS Launcher: MatInspector: Search for transcription factor binding sites via Genomatix Software". Genomatix Software.
- "FAM149A protein (Homo sapiens) – STRING network view".
- "I2D Protein Interactions". Retrieved 30 April 2013.
- Sumino J, Uzawa N, Okada N, Miyaguchi K, Mogushi K, Takahashi K, Sato H, Michikawa C, Nakata Y, Tanaka H, Amagasa T (February 2013). "Gene expression changes in initiation and progression of oral squamous cell carcinomas revealed by laser microdissection and oligonucleotide microarray analysis". Int. J. Cancer. 132 (3): 540–8. doi:10.1002/ijc.27702. PMID 22740306.
