Event chain diagram
Event chain diagrams are visualizations that show the relationships between events and tasks and how the events affect each other.
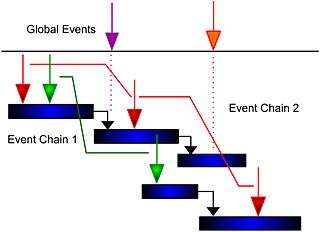
Event chain diagrams are introduced as a part of event chain methodology. Event chain methodology is an uncertainty modeling and schedule network analysis technique that is focused on identifying and managing events and event chains that affect project schedules. Event chain methodology is the next advance beyond critical path method and critical chain project management.
Rules
Event chain diagrams are presented on the Gantt chart according to the specification. This specification is a set of rules, which can be understood by anybody using this diagram.
For Single Events
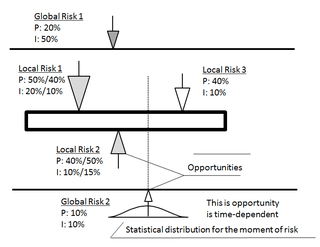
- Single events are shown as arrows on the bars on a Gantt Chart. Arrows pointing down represent threats. Arrows pointing up on the Gantt chart represent opportunities or event “Risk Response Plan is executed”. Two arrows in one point represent both threats and opportunities for one risk. The particular horizontal position of the arrow on the Gantt bar is not relevant.
- Issues are shown as arrow in the circle Color of the issue arrow is red (dark)
- Closed or transferred risks are shown using dashed lines. Color of arrow is white. Closed issue is shown in the circle with dashed border line.
- Global threats are shown at the top of the diagrams pointing down, global opportunities are shown at the bottom of diagrams pointing up. Both threats and opportunities belonging to the same global risk are placed at the top and at the bottom of the diagram along the same vertical line.
- Time-dependent global risks, or risks affecting activities running during certain period time, would have a vertical dashed line, associated with them. Statistical distribution for moment of risk can be shown around that arrow, representing time-dependent global risk.
- Colors of arrows represent the calculated the impact of the risk. Risks with higher are presented as red or dark arrows. Risks with low impact are presented as green or light arrows. The size of the arrow represents probability. If the arrow is small, the probability of the event is correspondingly small. Risk probability and impacts are before mitigation unless it otherwise explicitly noted on the diagram.
- Many different risks can be shown on the same Gantt bar. If there is no space to show all arrows, some risks with lower probability and impact can be omitted.
For Event Chains
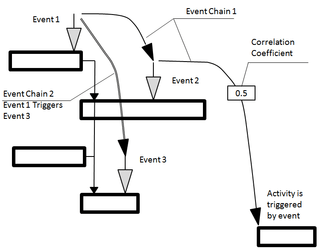
- Event chains are shown as lines connecting arrows depicting events. Both curved line or line containing multiple straight segments are acceptable.
- If one event triggers another event, event chain lines will have an arrow, pointing to the triggered event. If an event chain line does not have any arrows, it means that chain does not have any triggers, just events are correlated with each other.
- Correlation coefficient or probability that one event is triggered by another event is presented on event chain in the rectangular box.
- Event chains may trigger another activity. In this case event chain line will be connected with the beginning of activity with optional arrow.
- Event chains may trigger a group of activities. In this case this group of activities will be surrounded by the box or frame and event chain line will be connected to the corner of the box or first activity within a frame.
Often event chain diagrams can become very complex. In these cases, some details of the diagram do not need to be shown.
Optional rules
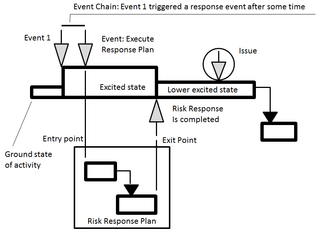
- Excited states are represented by elevating the associated section of the bar on the Gantt chart. The height of the state’s rectangle represents the relative impact of the event. All excited state of activities should have a textual description. Only states that have different event subscriptions than ground states should be shown.
- Statistical distribution of moment of risk may be shown above activity bar. Is it not recommended not to show uniform distributions for moment of risk as they are the default in many cases.
- Name of risk can be written next to the arrow and highlighted if probability and impact or risk ID written as well. Sometimes the same risk will be assigned to different tasks. In this case the name of risk will be the same for different arrows pointing to different bars.
- Risk probability and impact can be written next to the arrow. It is possible to cut names “Probability:” to “Prob:”, or just “P:”, and “Impact:” to “Imp:”, or just “I:”.
- Before mitigation and after mitigation risk probability and impact can be written together separated by slash “/”. For, example: “P: 50%/40%” means “Probability before mitigation is 50%; Probability after mitigation is 40%”
- Risk ID can be written next to the arrow.
- Event chains have a textual description
- Different event chains are presented using different color or line types
The central purpose of event chain diagrams is not to show all possible individual events. Rather, event chain diagrams can be used to understand the relationship between events. Therefore, it is recommended the event chain diagrams be used only for the most significant events during the event identification and analysis stage. Event chain diagrams can be used as part of the risk identification process, particularly during brainstorming meetings. Members of project teams can draw arrows between associated with activities on the Gantt chart. Event chain diagrams can be used together with other diagramming tools.
The simplest way to represent these chains is to depict them as arrows associated with certain tasks or time intervals on the Gantt chart. Different events and event chains can be displayed using different colors. Events can be global (for all tasks in the project) and local (for a particular task). By using event chain diagrams to visualize events and event chains, the modeling and analysis of risks and uncertainties can be significantly simplified.
State Tables
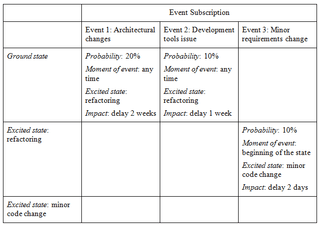
Another tool that can be used to simplify the definition of events is a state table. Columns in the state table represent events; rows represent the states of an activity. Information for each event in each state includes four properties of event subscription: probability, moment of event, excited state, and impact of the event. State tables help to depict an activity’s subscription to the events: if a cell is empty the state is not subscribed to the event.
The ground state of the activity is subscribed to two events: “architectural changes” and “development tools issue”. If either of these events occurs, they transform the activity to a new excited state called “refactoring”. “Refactoring” is subscribed to another event: “minor requirement change”. Two previous events are not subscribed to the refactoring state and therefore cannot reoccur while the activity is in this state.
See also
- PERT charts
- Gantt charts
- Run charts
References
- Hulett, David (2011), Integrated Cost-Schedule Risk Analysis, 1st Edition, USA: Gower, ISBN 978-0-5660916-6-7
- Schuyler, John (2016), Risk and Decision Analysis in Projects, 3rd Edition, USA: Planning Press, ISBN 978-0-9664401-6-4
- Virine, Lev & Trumper, Michael (2013), ProjectThink. Why Good Managers Make Poor Project Choices, Gower Pub Co., ISBN 978-1409454984CS1 maint: multiple names: authors list (link)
- Virine, Lev & Trumper, Michael (2017), Project Risk Analysis Made Ridiculously Simple, World Scientific Publishing, ISBN 978-9814759373CS1 maint: multiple names: authors list (link)
External links
| Wikimedia Commons has media related to Event chain methodology. |