California's 49th congressional district
California's 49th congressional district is a congressional district in the U.S. state of California. The district is represented by Mike Levin.
| California's 49th congressional district | |||
|---|---|---|---|
.tif.png) California's 49th congressional district since January 3, 2013. | |||
| Representative |
| ||
| Population (2013) | 717,823[1] | ||
| Median income | $88,314[2] | ||
| Ethnicity | |||
| Cook PVI | R+1[4] | ||
The district currently covers the northern coastal areas of San Diego County, including Oceanside, Vista, Carlsbad, and Encinitas, as well as a small portion of southern Orange County.[5] Marine Corps Base Camp Pendleton is in the district.
In the 2016 election, Darrell Issa won by a margin of less than 1%. In the 2018 election, this district was considered to be a major battleground. Rep. Issa announced that he would not seek reelection.[6] Following the November 6, 2018 election, Democrat Mike Levin became the district's congressman.[7]
Competitiveness
In statewide races
| Election results from statewide races | ||
|---|---|---|
| Year | Office | Results |
| 1992 | President[8] | Clinton (D) 43.4% – 31.5% |
| Senator[9] | Boxer (D) 49.3% – 41.5% | |
| Senator (Special)[9] | Feinstein (D) 53.9% – 38.7% | |
| 1994 | Governor[10] | Wilson (R) 57.4% – 38.2% |
| Senator[11] | Huffington (R) 46.1% - 45.9% | |
| 1996 | President[12] | Clinton (D) 48.9% - 40.3% |
| 1998 | Governor[13] | Davis (D) 54.5% - 40.6% |
| Senator[14] | Boxer (D) 51.9% – 43.8% | |
| 2000 | President[15] | Gore (D) 52.6% – 41.5% |
| Senator[16] | Feinstein (D) 58.7% – 33.8% | |
| 2002 | Governor[17] | Simon (R) 59.8% – 32.9% |
| 2003 | Recall[18][19] | |
| Schwarzenegger(R) 66.3% – 17.1% | ||
| 2004 | President[20] | Bush (R) 62.5% – 36.5% |
| Senator[21] | Jones (R) 54.2% – 41.6% | |
| 2006 | Governor[22] | Schwarzenegger (R) 71.4% – 24.1% |
| Senator[23] | Mountjoy (R) 52.5% – 42.5% | |
| 2008 | President[24] | McCain (R) 53.0% – 45.1% |
| 2010 | Governor[25] | Whitman (R) 56.5% – 36.1% |
| Senator[26] | Fiorina (R) 59.3% – 34.3% | |
| 2012 | President[27] | Romney (R) 52.4% – 45.7% |
| Senator[28] | Emken (R) 53.3% - 46.7% | |
| 2014 | Governor[29] | Kashkari (R) 55.0% – 45.0% |
| 2016 | President[30] | Clinton (D) 50.7% – 43.2% |
| Senator[31] | Harris (D) 60.3% – 39.7% | |
| 2018 | Governor[32] | Newsom (D) 51.5% – 48.5% |
| Senator[33] | Feinstein (D) 53.2% - 46.8% | |
List of members representing the district
District created January 3, 1993.
| Member | Party | Dates | Cong ress(es) |
Electoral history | Counties |
|---|---|---|---|---|---|
 Lynn Schenk |
Democratic | January 3, 1993 – January 3, 1995 |
103rd | Elected in 1992. Lost re-election. |
1993–2003 San Diego (San Diego) |
 Brian Bilbray |
Republican | January 3, 1995 – January 3, 2001 |
104th 105th 106th |
Elected in 1994. Re-elected in 1996. Re-elected in 1998. Lost re-election. | |
 Susan Davis |
Democratic | January 3, 2001 – January 3, 2003 |
107th | Elected in 2000. Redistricted to the 53rd district. | |
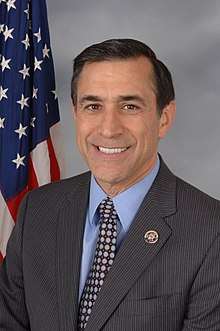 Darrell Issa |
Republican | January 3, 2003 – January 3, 2019 |
108th 109th 110th 111th 112th 113th 114th 115th |
Redistricted from the 48th district and re-elected in 2002. Re-elected in 2004. Re-elected in 2006. Re-elected in 2008. Re-elected in 2010. Re-elected in 2012. Re-elected in 2014. Re-elected in 2016. Retired. |
2003–2013 Riverside (Temecula); San Diego (Oceanside)  |
| 2013–Present Southern Orange (Dana Point and San Clemente); Northern San Diego (Carlsbad and Oceanside) .tif.png) | |||||
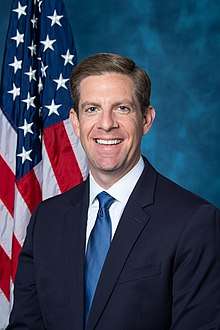 Mike Levin |
Democratic | January 3, 2019 – Present |
116th | Elected in 2018. |
Election results
|
1992 • 1994 • 1996 • 1998 • 2000 • 2002 • 2004 • 2006 • 2008 • 2010 • 2012 • 2014 • 2016 • 2018 • 2020 |
1992
| Party | Candidate | Votes | % | ||
|---|---|---|---|---|---|
| Democratic | Lynn Schenk | 127,280 | 51.1 | ||
| Republican | Judy Jarvis | 106,170 | 42.7 | ||
| Libertarian | John Wallner | 10,706 | 4.3 | ||
| Peace and Freedom | Milton Zaslow | 4,738 | 1.9 | ||
| Independent | Thompson (write-in) | 4 | 0.0 | ||
| Total votes | 248,898 | 100.0 | |||
| Democratic win (new seat) | |||||
1994
| Party | Candidate | Votes | % | |||
|---|---|---|---|---|---|---|
| Republican | Brian Bilbray | 90,283 | 48.5 | |||
| Democratic | Lynn Schenk (Incumbent) | 85,597 | 46.0 | |||
| Libertarian | Chris Hoogenboom | 5,288 | 2.8 | |||
| Peace and Freedom | Renate Kline | 4,948 | 2.7 | |||
| Independent | Thompson (write-in) | 2 | 0.0 | |||
| Total votes | 186,118 | 100.0 | ||||
| Republican gain from Democratic | ||||||
1996
| Party | Candidate | Votes | % | |
|---|---|---|---|---|
| Republican | Brian Bilbray (Incumbent) | 108,806 | 52.7 | |
| Democratic | Peter Navarro | 86,657 | 41.9 | |
| Libertarian | Ernie Lippe | 4,218 | 3.3 | |
| Reform | Kevin Hambsch | 3,773 | 1.8 | |
| Natural Law | Peter Stirling | 3,314 | 1.6 | |
| Total votes | 206,768 | 100.0 | ||
| Republican hold | ||||
1998
| Party | Candidate | Votes | % | |
|---|---|---|---|---|
| Republican | Brian Bilbray (Incumbent) | 90,516 | 48.8 | |
| Democratic | Christine T. Kehoe | 86,400 | 46.6 | |
| Libertarian | Ernest Lippe | 3,327 | 1.8 | |
| Natural Law | Julia F. Simon | 2,829 | 1.5 | |
| Peace and Freedom | Janice Jordan | 2,447 | 1.3 | |
| Total votes | 185,519 | 100.0 | ||
| Republican hold | ||||
2000
| Party | Candidate | Votes | % | |||
|---|---|---|---|---|---|---|
| Democratic | Susan Davis | 113,400 | 49.7 | |||
| Republican | Brian Bilbray (Incumbent) | 105,515 | 46.2 | |||
| Libertarian | Doris Ball | 6,526 | 2.8 | |||
| Natural Law | Tahir I. Bhatti | 3,048 | 1.3 | |||
| Total votes | 228,489 | 100.0 | ||||
| Democratic gain from Republican | ||||||
2002
| Party | Candidate | Votes | % | |
|---|---|---|---|---|
| Republican | Darrell Issa | 94,594 | 77.3 | |
| Libertarian | Karl W. Dietrich | 26,891 | 21.9 | |
| Democratic | Michael P. Byron (write-in) | 1,012 | 0.8 | |
| Total votes | 122,497 | 100.0 | ||
| Republican hold | ||||
2004
| Party | Candidate | Votes | % | |
|---|---|---|---|---|
| Republican | Darrell Issa (Incumbent) | 141,658 | 62.6 | |
| Democratic | Michael P. Byron | 79,057 | 34.9 | |
| Libertarian | Lars R. Grossmith | 5,751 | 2.5 | |
| Total votes | 226,466 | 100.0 | ||
| Republican hold | ||||
2006
| Party | Candidate | Votes | % | |
|---|---|---|---|---|
| Republican | Darrell Issa (Incumbent) | 98,891 | 63.3 | |
| Democratic | Jeeni Criscenzo | 52,227 | 33.5 | |
| Libertarian | Lars B. Grossmith | 4,952 | 3.2 | |
| Total votes | 156,070 | 100.0 | ||
| Republican hold | ||||
2008
| Party | Candidate | Votes | % | |
|---|---|---|---|---|
| Republican | Darrell Issa (Incumbent) | 140,300 | 58.3 | |
| Democratic | Robert Hamilton | 90,138 | 37.5 | |
| Libertarian | Lars B. Grossmith | 10,232 | 4.2 | |
| Total votes | 240,670 | 100.0 | ||
| Republican hold | ||||
2010
| Party | Candidate | Votes | % | |
|---|---|---|---|---|
| Republican | Darrell Issa (Incumbent) | 119,083 | 62.8 | |
| Democratic | Howard Katz | 59,710 | 31.5 | |
| American Independent | Dion Clark | 6,585 | 3.5 | |
| Libertarian | Mike Paster | 4,290 | 2.2 | |
| Total votes | 189,668 | 100.0 | ||
| Republican hold | ||||
2012
| Party | Candidate | Votes | % | |
|---|---|---|---|---|
| Republican | Darrell Issa (Incumbent) | 159,725 | 58.2 | |
| Democratic | Jerry Tetalman | 114,893 | 41.8 | |
| Total votes | 274,618 | 100.0 | ||
| Republican hold | ||||
2014
| Party | Candidate | Votes | % | |
|---|---|---|---|---|
| Republican | Darrell Issa (Incumbent) | 98,161 | 60.2 | |
| Democratic | Dave Peiser | 64,981 | 39.8 | |
| Total votes | 163,142 | 100.0 | ||
| Republican hold | ||||
2016
| Primary election | ||||
|---|---|---|---|---|
| Party | Candidate | Votes | % | |
| Republican | Darrell Issa (Incumbent) | 84,582 | 50.8 | |
| Democratic | Doug Applegate | 75,744 | 45.5 | |
| No party preference | Ryan Glenn Wingo | 6,079 | 3.7 | |
| Total votes | 166,405 | 100.0 | ||
| General election | ||||
| Republican | Darrell Issa (Incumbent) | 155,888 | 50.3 | |
| Democratic | Doug Applegate | 154,267 | 49.7 | |
| Total votes | 310,155 | 100.0 | ||
| Republican hold | ||||
2018
| Primary election | ||||
|---|---|---|---|---|
| Party | Candidate | Votes | % | |
| Republican | Diane Harkey | 46,468 | 25.5 | |
| Democratic | Mike Levin | 31,850 | 17.5 | |
| Democratic | Sara Jacobs | 28,778 | 15.8 | |
| Democratic | Doug Applegate | 23,850 | 13.1 | |
| Republican | Kristin Gaspar | 15,467 | 8.5 | |
| Republican | Rocky Chávez | 13,739 | 7.5 | |
| Democratic | Paul G. Kerr | 8,099 | 4.4 | |
| Republican | Brian Maryott | 5,496 | 3.0 | |
| Republican | Mike Schmitt | 2,379 | 1.3 | |
| Republican | Josh Schoonover | 1,362 | 0.7 | |
| Republican | Craig A. Nordal | 1,156 | 0.6 | |
| Republican | David Medway | 1,066 | 0.6 | |
| No party preference | Robert Pendleton | 905 | 0.5 | |
| Green | Danielle St. John | 690 | 0.4 | |
| Libertarian | Joshua L. Hancock | 552 | 0.3 | |
| Peace and Freedom | Jordan J. Mills | 233 | 0.1 | |
| Total votes | 182,090 | 100.0 | ||
| General election | ||||
| Democratic | Mike Levin | 166,453 | 56.4 | |
| Republican | Diane Harkey | 128,577 | 43.6 | |
| Total votes | 295,030 | 100.0 | ||
| Democratic gain from Republican | ||||
2020
| Party | Candidate | Votes | % | |
|---|---|---|---|---|
| Democratic | Mike Levin (Incumbent) | |||
| Republican | Brian Maryott | |||
| Total votes | ||||
| [[|N/A]] hold | ||||
Historical district boundaries
Before the 2002 redistricting, most of the territory currently located in the district was previously located in the 48th District. The 49th District was located farther south, encompassing most of what is now the 53rd District.
Before the 2012 redistricting the district extended further inland to include a portion of southern Riverside County and most of northern San Diego County.
References
- "American Fact Finder - Results". United States Census Bureau. Archived from the original on February 13, 2020. Retrieved May 21, 2015.
- Center for New Media & Promotion (CNMP), US Census Bureau. "My Congressional District". www.census.gov.
- "California's citizen commission final district maps: Find out what's changed where you live". latimes.com. August 2, 2011. Archived from the original on February 26, 2018. Retrieved April 25, 2018.
- "Partisan Voting Index – Districts of the 115th Congress" (PDF). The Cook Political Report. April 7, 2017. Archived (PDF) from the original on June 7, 2017. Retrieved April 7, 2017.
- "Congressional District 49" (PDF).
- Schneider, Elena; Bresnahan, John. "California Republican Darrell Issa to retire". POLITICO.
- 2018 election results
- Statement of Vote (1992 President)
- Statement of Vote (1992 Senate)
- Statement of Vote (1994 Governor)
- Statement of Vote (1994 Senate)
- Statement of Vote (1996 President)
- "Statement of Vote (1998 Governor)" (PDF). Archived from the original (PDF) on September 29, 2011.
- "Statement of Vote (1998 Senate)" (PDF). Archived from the original (PDF) on September 29, 2011.
- Statement of Vote (2000 President)
- Statement of Vote (2000 Senator)
- Statement of Vote (2002 Governor)
- Statement of Vote (2003 Recall Question)
- Statement of Vote (2003 Governor)
- Statement of Vote (2004 President)
- Statement of Vote (2004 Senator)
- Statement of Vote (2006 Governor)
- Statement of Vote (2006 Senator)
- Statement of Vote (2008 President)
- Statement of Vote (2010 Governor)
- Statement of Vote (2010 Senator)}}
- Statement of Vote (2012 President)
- Statement of Vote (2012 Senate)
- Statement of Vote (2014 Governor)
- Statement of Vote (2016 President)
- Statement of Vote (2016 Senate)
- Statement of Vote (2018 Governor)
- Statement of Vote (2018 Senator)
- 1992 election results
- 1994 election results
- 1996 election results
- 1998 election results
- 2000 election results
- 2002 election results
- 2004 election results
- 2006 election results
- 2008 election results
- 2010 election results
- 2012 election results
- 2014 election results
- "2016 open primary election results" (PDF).
- "2016 general election results" (PDF).
- "2018 open primary election results" (PDF).
- "2018 general election results" (PDF).