California's 46th congressional district
California's 46th congressional district is a congressional district in the U.S. state of California.
| California's 46th congressional district | |||
|---|---|---|---|
.tif.png) California's 46th congressional district since January 3, 2013 | |||
| Representative |
| ||
| Population (2017[1]) | 734,649 | ||
| Median income | $65,334[2] | ||
| Ethnicity | |||
| Cook PVI | D+15[4] | ||
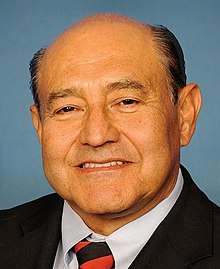
The district is currently represented by Democrat Lou Correa. The district is based in Orange County and includes the communities of Anaheim and Santa Ana, as well as parts of Orange. It is both the most liberal and most Latino Congressional district in Orange County.
The Congressional district also contains the theme park Disneyland.
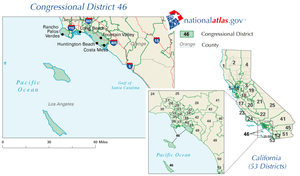
From 2003 to 2013 the district covered part of Los Angeles County and Orange County. The district included Huntington Beach, Costa Mesa, and Rancho Palos Verdes.
Competitiveness
In statewide races
| Election results from statewide races | ||
|---|---|---|
| Year | Office | Results |
| 1992 | President[5] | Bush 39.9% – 37.1% |
| Senator[6] | Herschensohn 53.1% – 36.2% | |
| Senator (Special)[7] | Seymour 45.7% – 42.6% | |
| 1994 | Governor[8] | Wilson 60.1% – 34.1% |
| Senator[9] | Huffington 54.2% – 33.2% | |
| 1996 | President[10] | Clinton 48.3% – 40.8% |
| 1998 | Governor[11] | Davis 55.9% - 39.6% |
| Senator[12] | Boxer 49.9% – 44.2% | |
| 2000 | President[13] | Gore 54.1% – 42.3% |
| Senator[14] | Feinstein 49.9% – 44.2% | |
| 2002 | Governor[15] | Simon 55.8% – 36.4% |
| 2003 | Recall[16][17] | |
| Schwarzenegger 62.2% – 17.8% | ||
| 2004 | President[18] | Bush 56.9% – 41.6% |
| Senator[19] | Jones 48.6% – 45.5% | |
| 2006 | Governor[20] | Schwarzenegger 68.9% – 26.3% |
| Senator[21] | Feinstein 47.9% – 47.1% | |
| 2008 | President[22] | McCain 49.8% – 48.0% |
| 2010 | Governor[23] | Whitman 55.8% – 38.8% |
| Senator[24] | Fiorina 56.4% – 38.4% | |
| 2012 | President[25] | Obama 61.4% – 36.2% |
| Senator[26] | Feinstein 63.0% – 37.0% | |
| 2014 | Governor[27] | Brown 59.5% – 40.5% |
| 2016 | President[28] | Clinton 66.3% – 27.9% |
| Senator[29] | Sanchez 58.7% – 41.3% | |
| 2018 | Governor[30] | Newsom 63.8% – 36.2% |
| Senator[31] | Feinstein 52.8% – 47.2% | |
| Lieutenant Governor[32] | Hernandez 52.8% – 47.2% | |
| Secretary of State[32] | Padilla 67.1% – 32.9% | |
| Controller[32] | Yee 67.0% – 33.0% | |
| Treasurer[32] | Ma 65.9% – 34.1% | |
| Attorney General[32] | Becerra 66.2% – 33.8% | |
| Insurance Commissioner[32] | Lara 59.9% – 40.1% | |
| State Board of Equalization, 4th District[32] | Schaefer 63.4% – 36.6% | |
List of members representing the district
District created January 3, 1993.
Election results
1992
| Party | Candidate | Votes | % | |
|---|---|---|---|---|
| Republican | Bob Dornan (Incumbent) | 55,659 | 50.2 | |
| Democratic | Robert John Banuelos | 45,435 | 41.0 | |
| Libertarian | Richard G. Newhouse | 9,712 | 8.8 | |
| Total votes | 110,806 | 100.0 | ||
| Republican hold | ||||
1994
| Party | Candidate | Votes | % | |
|---|---|---|---|---|
| Republican | Bob Dornan (Incumbent) | 50,616 | 57.1 | |
| Democratic | Michael P. "Mike" Farber | 33,004 | 37.2 | |
| Libertarian | Richard G. Newhouse | 5,077 | 5.7 | |
| Total votes | 88,697 | 100.0 | ||
| Republican hold | ||||
1996
| Party | Candidate | Votes | % | |||
|---|---|---|---|---|---|---|
| Democratic | Loretta Sanchez | 47,964 | 46.9 | |||
| Republican | Bob Dornan (Incumbent) | 46,980 | 45.9 | |||
| Reform | Lawrence Stafford | 3,235 | 3.1 | |||
| Libertarian | Thomas Reimer | 2,333 | 2.2 | |||
| Natural Law | J. Aguirre | 1,972 | 1.9 | |||
| Total votes | 102,484 | 100.0 | ||||
| Democratic gain from Republican | ||||||
1998
| Party | Candidate | Votes | % | |
|---|---|---|---|---|
| Democratic | Loretta Sanchez (Incumbent) | 47,964 | 56.4 | |
| Republican | Bob Dornan | 33,388 | 39.3 | |
| Libertarian | Thomas E. Reimer | 2,316 | 2.7 | |
| Natural Law | Larry G. Engwall | 1,334 | 1.6 | |
| Total votes | 85,002 | 100.0 | ||
| Democratic hold | ||||
2000
| Party | Candidate | Votes | % | |
|---|---|---|---|---|
| Democratic | Loretta Sanchez (Incumbent) | 70,381 | 60.3 | |
| Republican | Gloria Matta Tuchman | 40,928 | 35.0 | |
| Libertarian | Richard B. Boddie | 3,159 | 2.7 | |
| Natural Law | Larry Engwall | 2,440 | 2.0 | |
| Total votes | 116,908 | 100.0 | ||
| Democratic hold | ||||
2002
| Party | Candidate | Votes | % | |
|---|---|---|---|---|
| Republican | Dana Rohrabacher (Incumbent) | 108,807 | 61.8 | |
| Democratic | Gerrie Schipske | 60,890 | 34.6 | |
| Libertarian | Keith Gann | 6,488 | 3.6 | |
| Independent | Thomas Lash (write-in) | 80 | 0.0 | |
| Total votes | 176,165 | 100.0 | ||
| Republican hold | ||||
2004
| Party | Candidate | Votes | % | |
|---|---|---|---|---|
| Republican | Dana Rohrabacher (Incumbent) | 171,318 | 62.0 | |
| Democratic | Jim Brandt | 90,129 | 32.5 | |
| Green | Tom Lash | 10,238 | 3.7 | |
| Total votes | 271,685 | 100.0 | ||
| Republican hold | ||||
2006
| Party | Candidate | Votes | % | |
|---|---|---|---|---|
| Republican | Dana Rohrabacher (Incumbent) | 116,176 | 59.6 | |
| Democratic | Jim Brandt | 71,573 | 36.7 | |
| Libertarian | Dennis Chang | 7,303 | 3.7 | |
| Total votes | 195,052 | 100.0 | ||
| Republican hold | ||||
2008
| Party | Candidate | Votes | % | |
|---|---|---|---|---|
| Republican | Dana Rohrabacher (Incumbent) | 149,818 | 52.5 | |
| Democratic | Debbie Cook | 122,891 | 43.1 | |
| Green | Thomas Lash | 8,257 | 2.9 | |
| Libertarian | Ernst P. Gasteiger | 4,311 | 1.5 | |
| Total votes | 285,277 | 100.0 | ||
| Republican hold | ||||
2010
| Party | Candidate | Votes | % | |
|---|---|---|---|---|
| Republican | Dana Rohrabacher (Incumbent) | 139,822 | 62.2 | |
| Democratic | Ken Arnold | 84,940 | 37.8 | |
| Total votes | 224,762 | 100.0 | ||
| Republican hold | ||||
2012
| Party | Candidate | Votes | % | |
|---|---|---|---|---|
| Democratic | Loretta Sanchez (Incumbent) | 95,694 | 63.9 | |
| Republican | Jerry Hayden | 54,121 | 36.1 | |
| Total votes | 149,815 | 100.0 | ||
| Democratic hold | ||||
2014
| Party | Candidate | Votes | % | |
|---|---|---|---|---|
| Democratic | Loretta Sanchez (Incumbent) | 49,738 | 59.7 | |
| Republican | Adam Nick | 33,577 | 40.3 | |
| Total votes | 83,315 | 100.0 | ||
| Democratic hold | ||||
2016
| Party | Candidate | Votes | % | |
|---|---|---|---|---|
| Democratic | Lou Correa | 115,248 | 70.0 | |
| Democratic | Bao Nguyen | 49,345 | 30.0 | |
| Total votes | 164,593 | 100.0 | ||
| Democratic hold | ||||
2018
| Party | Candidate | Votes | % | |
|---|---|---|---|---|
| Democratic | Lou Correa (Incumbent) | 102,278 | 69.1 | |
| Republican | Russell Rene Lambert | 45,638 | 30.9 | |
| Total votes | 147,916 | 100.0 | ||
| Democratic hold | ||||
Historical district boundaries
The district was commonly considered[47] to be typical of gerrymandering. It covered some or all of the following cities in Orange County: Costa Mesa, Fountain Valley, Huntington Beach, Los Alamitos, Seal Beach, and Westminster. In Los Angeles County, the district covered Rancho Palos Verdes, Rolling Hills, Rolling Hills Estates, Palos Verdes Estates part of Long Beach, and a very small portion of the San Pedro neighborhood of the City of Los Angeles, and Santa Catalina Island, on which Avalon was the only city. The district also included the whole of the Port of Los Angeles and Long Beach.
References
- https://www.census.gov/mycd/?st=06&cd=46
- US Census
- "California's citizen commission final district maps: Find out what's changed where you live". Los Angeles Times. August 2, 2011.
- "Partisan Voting Index – Districts of the 115th Congress" (PDF). The Cook Political Report. April 7, 2017. Retrieved April 7, 2017.
- Statement of Vote (1992 President)
- Statement of Vote (1992 Senate)
- Statement of Vote (1992 Senate)
- Statement of Vote (1994 Governor)
- Statement of Vote (1994 Senate)
- Statement of Vote (1996 President)
- Statement of Vote (1998 Governor) Archived September 29, 2011, at the Wayback Machine
- Statement of Vote (1998 Senate) Archived September 29, 2011, at the Wayback Machine
- Statement of Vote (2000 President)
- Statement of Vote (2000 Senator)
- Statement of Vote (2002 Governor)
- Statement of Vote (2003 Recall Question)
- Statement of Vote (2003 Governor)
- Statement of Vote (2004 President)
- Statement of Vote (2004 Senator)
- Statement of Vote (2006 Governor)
- Statement of Vote (2006 Senator)
- Statement of Vote (2008 President)
- Statement of Vote (2010 Governor)
- Statement of Vote (2010 Senator)}}
- Statement of Vote (2012 President)
- Statement of Vote (2012 Senate)
- Statement of Vote (2014 Governor)
- Statement of Vote (2016 President)
- Statement of Vote (2016 Senate)
- Statement of Vote (2018 Governor)
- Statement of Vote (2018 Senator)
- 1992 election results
- 1994 election results
- 1996 election results
- 1998 election results
- 2000 election results
- 2002 election results
- 2004 election results
- 2006 election results
- 2008 election results
- 2010 election results
- 2012 election results
- 2014 election results
- 2016 election results
- 2018 election results
- Patrick McGreevy (December 19, 2010). "New redistricting panel takes aim at bizarre political boundaries". Los Angeles Times. Retrieved December 23, 2010.
.tif.png)
