California's 42nd congressional district
California's 42nd congressional district is a congressional district in the U.S. state of California.
| California's 42nd congressional district | |||
|---|---|---|---|
.tif.png) California's 42nd congressional district since January 3, 2013. | |||
| Representative |
| ||
| Population (2018) | 826,801[1] | ||
| Median income | $89,086[1] | ||
| Ethnicity | |||
| Cook PVI | R+9[2] | ||
The district is currently represented by Republican Ken Calvert. The district is entirely within Riverside County in the Inland Empire, including the cities of Eastvale, Norco, Corona, Lake Elsinore, Menifee, Wildomar, Murrieta, and portions of Temecula.
Competitiveness
In statewide races
| Election results from statewide races | ||
|---|---|---|
| Year | Office | Results |
| 1990 | Governor[3] | Wilson 62.0% - 33.8% |
| 1992 | President[4] | Clinton 45.9% - 32.8% |
| Senator[5] | Herschensohn 45.4% - 43.2% | |
| Senator (Special)[5] | Seymour 50.7% - 44.0% | |
| 1994 | Governor[6] | Wilson 55.6% - 36.9% |
| Senator[7] | Huffington 49.3% – 39.6% | |
| 1996 | President[8] | Clinton 53.5% - 35.6% |
| 1998 | Governor[9] | Davis 61.3% - 31.7% |
| Senator[10] | Boxer 56.7% – 38.1% | |
| 2000 | President[11] | Gore 57.0% - 39.3% |
| Senator[12] | Feinstein 58.5% - 34.2% | |
| 2002 | Governor[13] | Simon 61.1% - 31.9% |
| 2003 | Recall[14][15] | |
| Schwarzenegger 66.0% - 15.3% | ||
| 2004 | President[16] | Bush 62.0% - 36.9% |
| Senator[17] | Jones 54.1% - 41.6% | |
| 2006 | Governor[18] | Schwarzenegger 71.1% - 24.6% |
| Senator[19] | Mountjoy 52.9% - 42.5% | |
| 2008 | President[20] | McCain 53.2% - 44.9% |
| 2010 | Governor[21] | Whitman 59.1% - 35.2% |
| Senator[22] | Fiorina 61.2% - 33.8% | |
| 2012 | President[23] | Romney 56.5% - 41.4% |
| Senator[24] | Emken 56.8% - 43.2% | |
| 2014 | Governor[25] | Kashkari 63.2% – 36.8% |
| 2016 | President[26] | Trump 53.4%- 41.4% |
| Senator[27] | Harris 54.6% - 45.4% | |
| 2018 | Governor[28] | Cox 58.8% – 41.2% |
| Senator[29] | de León 52.1% - 47.9% | |
List of members representing the district
District created January 3, 1973.
| Member | Party | Dates | Cong ress(es) |
Electoral history | Counties |
|---|---|---|---|---|---|
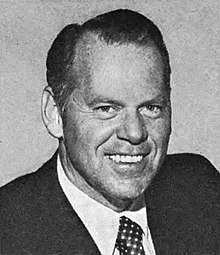 |
Republican | January 3, 1973 – January 3, 1975 |
93rd | Elected in 1972. Redistricted to the 43rd district. |
1973–1975 Southern Coastal Orange, Coastal San Diego outside the city |
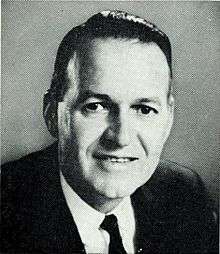 |
Democratic | January 3, 1975 – January 3, 1981 |
94th 95th 96th |
Redistricted from the 41st district and re-elected in 1974. Re-elected in 1976. Re-elected in 1978. Lost re-election. |
1975–1983 San Diego (San Diego City southern half) |
 |
Republican | January 3, 1981 – January 3, 1983 |
97th | Elected in 1980. Redistricted to the 45th district. | |
 |
Republican | January 3, 1983 – January 3, 1989 |
98th 99th 100th |
Redistricted from the 34th district and re-elected in 1982. Re-elected in 1984. Re-elected in 1986. Appointed acting California State Treasurer. |
1983–1993 Los Angeles (Palos Verdes), Northwestern Orange |
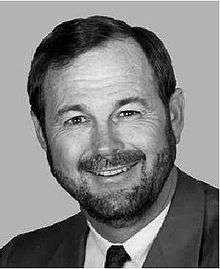 |
Republican | January 3, 1989 – January 3, 1993 |
101st 102nd |
Elected in 1988. Re-elected in 1990. Redistricted to the 45th district. | |
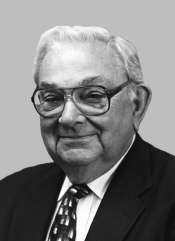 |
Democratic | January 3, 1993 – July 15, 1999 |
103rd 104th 105th 106th |
Redistricted from the 36th district and re-elected in 1992. Re-elected in 1994. Re-elected in 1996. Re-elected in 1998. Died. |
1993–2003 San Bernardino (Inland Empire) |
| Vacant | July 15, 1999 – November 16, 1999 |
||||
 |
Democratic | November 16, 1999 – January 3, 2003 |
106th 107th |
Elected to finish Brown's term. Re-elected in 2000. Redistricted to the 43rd district. | |
 |
Republican | January 3, 2003 – January 3, 2013 |
108th 109th 110th 111th 112th |
Redistricted from the 41st district and re-elected in 2002. Re-elected in 2004. Re-elected in 2006. Re-elected in 2008. Re-elected in 2010. Redistricted to the 31st district. |
2003–2013 Southeastern Los Angeles, Northeastern Orange, Southwestern San Bernardino 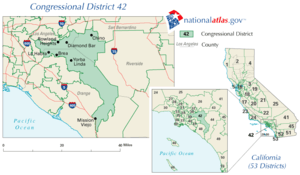 |
 |
Republican | January 3, 2013 – present |
113th 114th 115th 116th |
Redistricted from the 44th district and re-elected in 2012. Re-elected in 2014. Re-elected in 2016. Re-elected in 2018. |
2013–Present Inland Empire (Corona and Murrieta) .tif.png) |
Election results
|
1972 • 1974 • 1976 • 1978 • 1980 • 1982 • 1984 • 1986 • 1988 • 1990 • 1992 • 1994 • 1996 • 1998 • 1999 (Special) • 2000 • 2002 • 2004 • 2006 • 2008 • 2010 • 2012 • 2014 • 2016 • 2018 |
1972
| Party | Candidate | Votes | % | ||
|---|---|---|---|---|---|
| Republican | Clair Burgener (Incumbent) | 155,965 | 67.4 | ||
| Democratic | Bob Lowe | 67,477 | 29.2 | ||
| American Independent | Armin R. Moths | 7,812 | 3.4 | ||
| Total votes | 231,254 | 100.0 | |||
| Republican win (new seat) | |||||
1974
| Party | Candidate | Votes | % | |
|---|---|---|---|---|
| Democratic | Lionel Van Deerlin (Incumbent) | 69,746 | 69.9 | |
| Republican | Wes Marden | 30,058 | 30.1 | |
| Total votes | 99,804 | 100.0 | ||
| Democratic hold | ||||
1976
| Party | Candidate | Votes | % | |
|---|---|---|---|---|
| Democratic | Lionel Van Deerlin (Incumbent) | 103,062 | 76.0 | |
| Republican | Wes Marden | 32,565 | 24.0 | |
| Total votes | 135,627 | 100.0 | ||
| Democratic hold | ||||
1978
| Party | Candidate | Votes | % | |
|---|---|---|---|---|
| Democratic | Lionel Van Deerlin (Incumbent) | 85,126 | 73.7 | |
| Republican | Lawrence C. Mattera | 30,319 | 26.3 | |
| Total votes | 115,445 | 100.0 | ||
| Democratic hold | ||||
1980
| Party | Candidate | Votes | % | |||
|---|---|---|---|---|---|---|
| Republican | Duncan Hunter | 79,713 | 53.3 | |||
| Democratic | Lionel Van Deerlin (Incumbent) | 69,936 | 46.7 | |||
| Total votes | 149,649 | 100.0 | ||||
| Republican gain from Democratic | ||||||
1982
| Party | Candidate | Votes | % | |
|---|---|---|---|---|
| Republican | Dan Lungren (Incumbent) | 142,845 | 69.0 | |
| Democratic | James P. Spellman | 58,690 | 28.3 | |
| Peace and Freedom | John S. Donohue | 5,514 | 2.7 | |
| Total votes | 207,049 | 100.0 | ||
| Republican hold | ||||
1984
| Party | Candidate | Votes | % | |
|---|---|---|---|---|
| Republican | Dan Lungren (Incumbent) | 177,783 | 73.0 | |
| Democratic | Mary Lou Brophy | 60,025 | 24.6 | |
| Peace and Freedom | John S. Donohue | 5,811 | 2.4 | |
| Total votes | 243,619 | 100.0 | ||
| Republican hold | ||||
1986
| Party | Candidate | Votes | % | |
|---|---|---|---|---|
| Republican | Dan Lungren (Incumbent) | 140,364 | 72.8 | |
| Democratic | Michael P. Blackburn | 47,586 | 24.7 | |
| Peace and Freedom | Kate McClatchy | 4,761 | 2.5 | |
| Total votes | 192,711 | 100.0 | ||
| Republican hold | ||||
1988
| Party | Candidate | Votes | % | |
|---|---|---|---|---|
| Republican | Dana Rohrabacher | 153,280 | 64.2 | |
| Democratic | Guy C. Kimbrough | 78,778 | 33.0 | |
| Libertarian | Richard D. Rose | 6,563 | 2.8 | |
| Total votes | 238,621 | 100.0 | ||
| Republican hold | ||||
1990
| Party | Candidate | Votes | % | |
|---|---|---|---|---|
| Republican | Dana Rohrabacher (Incumbent) | 109,353 | 59.3 | |
| Democratic | Guy C. Kimbrough | 67,189 | 36.5 | |
| Libertarian | Richard Gibb Martin | 7,744 | 4.2 | |
| Total votes | 184,286 | 100.0 | ||
| Republican hold | ||||
1992
| Party | Candidate | Votes | % | |
|---|---|---|---|---|
| Democratic | George Brown, Jr. (Incumbent) | 79,780 | 50.7 | |
| Republican | Dick Rutan | 69,251 | 44.0 | |
| Libertarian | Fritz R. Ward | 8,424 | 5.3 | |
| Total votes | 157,455 | 100.0 | ||
| Democratic hold | ||||
1994
| Party | Candidate | Votes | % | |
|---|---|---|---|---|
| Democratic | George Brown, Jr. (Incumbent) | 58,888 | 51.1 | |
| Republican | Rob Guzman | 56,259 | 48.9 | |
| Independent | LaBine (write-in) | 44 | 0.0 | |
| Independent | Sanchez (write-in) | 14 | 0.0 | |
| Total votes | 115,205 | 100.0 | ||
| Democratic hold | ||||
1996
| Party | Candidate | Votes | % | |
|---|---|---|---|---|
| Democratic | George Brown, Jr. (Incumbent) | 52,166 | 50.5 | |
| Republican | Linda Wilde | 51,170 | 49.5 | |
| Total votes | 103,336 | 100.0 | ||
| Democratic hold | ||||
1998
| Party | Candidate | Votes | % | |
|---|---|---|---|---|
| Democratic | George Brown, Jr. (Incumbent) | 62,207 | 55.3 | |
| Republican | Elia Pirozzi | 45,328 | 40.3 | |
| American Independent | Hale McGee | 3,086 | 2.7 | |
| Libertarian | David Lynn Hollist | 1,899 | 1.7 | |
| Total votes | 112,520 | 100.0 | ||
| Democratic hold | ||||
1999 (Special)
| Party | Candidate | Votes | % | |
|---|---|---|---|---|
| Democratic | Joe Baca | 23,690 | 50.5 | |
| Republican | Elia Pirozzi | 21,018 | 44.9 | |
| Reform | Rick Simon | 1,198 | 2.6 | |
| Libertarian | John S. Ballard | 956 | 2.0 | |
| Total votes | 46,862 | 100.0 | ||
| Turnout | 19.4 | |||
| Democratic hold | ||||
2000
| Party | Candidate | Votes | % | |
|---|---|---|---|---|
| Democratic | Joe Baca (Incumbent) | 90,585 | 59.8 | |
| Republican | Eli Pirozzi | 53,239 | 35.2 | |
| Libertarian | John "Scott" Ballard | 4,059 | 2.6 | |
| Natural Law | Gwyn Hartley | 3,694 | 2.4 | |
| Total votes | 151,577 | 100.0 | ||
| Democratic hold | ||||
2002
| Party | Candidate | Votes | % | |
|---|---|---|---|---|
| Republican | Gary Miller (Incumbent) | 98,476 | 67.8 | |
| Democratic | Richard Waldron | 42,090 | 29.0 | |
| Libertarian | Donald Yee | 4,680 | 3.2 | |
| Total votes | 145,186 | 100.0 | ||
| Republican hold | ||||
2004
| Party | Candidate | Votes | % | |
|---|---|---|---|---|
| Republican | Gary Miller (Incumbent) | 167,632 | 68.2 | |
| Democratic | Lewis Myers | 78,393 | 31.8 | |
| Total votes | 246,025 | 100.0 | ||
| Republican hold | ||||
2006
| Party | Candidate | Votes | % | |
|---|---|---|---|---|
| Republican | Gary Miller (Incumbent) | 129,720 | 100.0 | |
| Republican hold | ||||
2008
| Party | Candidate | Votes | % | |
|---|---|---|---|---|
| Republican | Gary Miller (Incumbent) | 158,404 | 60.2 | |
| Democratic | Ed Chau | 104,909 | 39.8 | |
| Total votes | 263,313 | 100.0 | ||
| Republican hold | ||||
2010
| Party | Candidate | Votes | % | |
|---|---|---|---|---|
| Republican | Gary Miller (Incumbent) | 127,161 | 62.3 | |
| Democratic | Michael Williamson | 65,122 | 31.8 | |
| Libertarian | Mark Lambert | 12,115 | 5.9 | |
| Total votes | 204,398 | 100.0 | ||
| Republican hold | ||||
2012
| Party | Candidate | Votes | % | |
|---|---|---|---|---|
| Republican | Ken Calvert (Incumbent) | 130,245 | 60.6 | |
| Democratic | Michael Williamson | 84,702 | 39.4 | |
| Total votes | 214,947 | 100.0 | ||
| Republican hold | ||||
2014
| Party | Candidate | Votes | % | |
|---|---|---|---|---|
| Republican | Ken Calvert (Incumbent) | 74,540 | 65.7 | |
| Democratic | Tim Sheridan | 38,850 | 34.3 | |
| Total votes | 113,390 | 100.0 | ||
| Republican hold | ||||
2016
| Party | Candidate | Votes | % | |
|---|---|---|---|---|
| Republican | Ken Calvert (Incumbent) | 149,547 | 58.8 | |
| Democratic | Tim Sheridan | 104,689 | 41.2 | |
| Total votes | 254,236 | 100.0 | ||
| Republican hold | ||||
2018
| Party | Candidate | Votes | % | |
|---|---|---|---|---|
| Republican | Ken Calvert (Incumbent) | 131,040 | 56.5 | |
| Democratic | Julia C. Peacock | 100,892 | 43.5 | |
| Total votes | 231,932 | 100.0 | ||
| Republican hold | ||||
Historical district boundaries
From 2003 to 2013, the district covered parts of Los Angeles, Orange, and San Bernardino counties in Southern California.
gollark: Did v1 have charts at all?
gollark: 🦀 👟
gollark: <@!442898169681149954> 🦀
gollark: The greater problem is that it's unmaintained and anyone who might actually know the code well enough to work on it is now working on v2 and under NDAs for some bizarre reason.
gollark: Er, basically, there's some configuration set which probably isn't right for all environments, but that's not a complex fix either.
References
- "Congressional District 42 (116th Congress), California". census.gov. U.S. Census Bureau. Retrieved 2020-07-17.
- "Partisan Voting Index – Districts of the 115th Congress" (PDF). The Cook Political Report. April 7, 2017. Retrieved April 7, 2017.
- Statement of Vote (1990 Governor)
- Statement of Vote (1992 President)
- Statement of Vote (1992 Senate)
- Statement of Vote (1994 Governor)
- Statement of Vote (1994 Senate)
- Statement of Vote (1996 President)
- Statement of Vote (1998 Governor) Archived September 29, 2011, at the Wayback Machine
- Statement of Vote (1998 Senate) Archived September 29, 2011, at the Wayback Machine
- Statement of Vote (2000 President)
- Statement of Vote (2000 Senator)
- Statement of Vote (2002 Governor)
- Statement of Vote (2003 Recall Question)
- Statement of Vote (2003 Governor)
- Statement of Vote (2004 President)
- Statement of Vote (2004 Senator)
- Statement of Vote (2006 Governor)
- Statement of Vote (2006 Senator)
- Statement of Vote (2008 President)
- Statement of Vote (2010 Governor)
- Statement of Vote (2010 Senator)
- Statement of Vote (2012 President)
- Statement of Vote (2012 Senator)
- Statement of Vote (2014 Governor)
- Statement of Vote (2016 President)
- Statement of Vote (2016 Senator)
- Statement of Vote (2018 Governor)
- Statement of Vote (2018 Senator)
- 1972 election results
- 1974 election results
- 1976 election results
- 1978 election results
- 1980 election results
- 1982 election results
- 1984 election results
- 1986 election results
- 1988 election results
- 1990 election results
- 1992 election results
- 1994 election results
- 1996 election results
- 1998 election results
- 1999 special election results
- 1999 special election results
- 2000 election results
- 2002 election results
- 2004 election results
- 2006 election results
- 2008 election results
- 2010 election results
- 2012 election results
- 2014 election results
- 2016 election results
- 2018 election results
External links
This article is issued from Wikipedia. The text is licensed under Creative Commons - Attribution - Sharealike. Additional terms may apply for the media files.