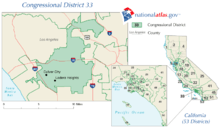
California's 33rd congressional district
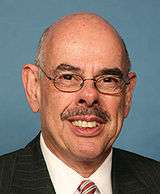
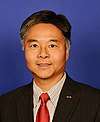
California's 33rd congressional district is a congressional district in the U.S. state of California based in Los Angeles County. The district is currently represented by Democrat Ted Lieu. In 2014, after 40 years in Congress, previous representative Henry Waxman announced his retirement.
| California's 33rd congressional district | |||
|---|---|---|---|
.tif.png) California's 33rd congressional district since January 3, 2013 | |||
| Representative |
| ||
| Area | 480 sq mi (1,200 km2) | ||
| Median income | $105,200[1] | ||
| Ethnicity | |||
| Cook PVI | D+16[3] | ||
People announcing their campaigns for this seat in the 2014 election cycle included: author Marianne Williamson, director Brent Roske, producer/historian Vince Flaherty and Deputy District Attorney for L.A. County Elan Carr.[4] State Senator Ted Lieu succeeded Henry Waxman in Congress in January 2015, after having defeated Los Angeles County deputy district attorney Elan Carr in the November 4 general election.
The district includes cities, communities, and districts on the West side of Los Angeles, the South Bay beach cities including portions of Torrance and the entire Palos Verdes Peninsula within Los Angeles County. They include:
- Agoura Hills
- Bel Air
- Beverly Hills
- Brentwood
- Calabasas
- El Segundo
- Fairfax District, Los Angeles
- Hermosa Beach
- Holmby Hills
- Malibu
- Manhattan Beach
- Marina del Rey
- Pacific Palisades
- Palos Verdes Estates
- Playa del Rey
- Rancho Palos Verdes
- Redondo Beach
- Rolling Hills
- Rolling Hills Estates
- Santa Monica
- Santa Monica Mountains communities and parks
- Topanga
- Torrance (90503 and 90505 zip codes)
- University of California, Los Angeles campus
- Venice
- Westwood
Competitiveness
In statewide races
| Election results from statewide races | ||
|---|---|---|
| Year | Office | Results |
| 1990 | Governor[5] | Wilson 59.4% - 35.5% |
| 1992 | President[6] | Clinton 63.0% - 23.6% |
| Senator[7] | Boxer 59.3% - 29.9% | |
| Senator (Special)[8] | Feinstein 65.8% - 25.9% | |
| 1994 | Governor[9] | Brown 61.2% - 31.1% |
| Senator[10] | Feinstein 58.1% - 28.4% | |
| 1996 | President[11] | Clinton 79.7% - 14.0% |
| 1998 | Governor[12] | Davis 83.4% - 13.4% |
| Senator[13] | Boxer 79.9% – 16.4% | |
| 2000 | President[14] | Gore 82.6% - 14.9% |
| Senator[15] | Feinstein 81.7% - 11.4% | |
| 2002 | Governor[16] | Davis 74.7% - 15.2% |
| 2003 | Recall[17][18] | |
| Bustamante 57.0% - 24.5% | ||
| 2004 | President[19] | Kerry 82.8% - 15.9% |
| Senator[20] | Boxer 83.5% - 11.7% | |
| 2006 | Governor[21] | Angelides 69.4% - 25.6% |
| Senator[22] | Feinstein 83.7% - 10.8% | |
| 2008 | President[23] | Obama 86.8% - 11.7% |
| 2010 | Governor[24] | Brown 82.9% - 13.4% |
| Senator[25] | Boxer 83.2% - 13.0% | |
| 2012 | President[26] | Obama 60.6% - 36.8% |
| Senator[27] | Feinstein 64.5% - 35.5% | |
| 2014 | Governor[28] | Brown 61.6% – 38.4% |
| 2016 | President[29] | Clinton 67.8% - 26.5% |
| Senator[30] | Harris 70.9% - 29.1% | |
| 2018 | Governor[31] | Newsom 67.7% – 32.3% |
| Senator[32] | Feinstein 62.4% – 37.6% | |
List of members representing the district
District created January 3, 1963

.tif.png)
Election results
|
1962 • 1964 • 1966 • 1968 • 1970 • 1972 • 1974 • 1976 • 1978 • 1980 • 1982 • 1984 • 1986 • 1988 • 1990 • 1992 • 1994 • 1996 • 1998 • 2000 • 2002 • 2004 • 2006 • 2008 • 2010 • 2012 • 2014 • 2016 • 2018 |
1962
| Party | Candidate | Votes | % | |
|---|---|---|---|---|
| Democratic | Harry R. Sheppard (Incumbent) | 96,192 | 59.0 | |
| Republican | William R. Thomas | 66,764 | 41.0 | |
| Total votes | 162,956 | 100.0 | ||
| Democratic hold | ||||
1964
| Party | Candidate | Votes | % | |
|---|---|---|---|---|
| Democratic | Kenneth W. Dyal | 109,047 | 51.7 | |
| Republican | Jerry Pettis | 101,742 | 48.3 | |
| Total votes | 210,789 | 100.0 | ||
| Democratic hold | ||||
1966
| Party | Candidate | Votes | % | |||
|---|---|---|---|---|---|---|
| Republican | Jerry Pettis | 102,401 | 53.5 | |||
| Democratic | Kenneth W. Dyal (incumbent) | 89,071 | 46.5 | |||
| Total votes | 191,472 | 100.0 | ||||
| Republican gain from Democratic | ||||||
1968
| Party | Candidate | Votes | % | |
|---|---|---|---|---|
| Republican | Jerry Pettis (Incumbent) | 123,426 | 66.3 | |
| Democratic | Al C. Bellard | 59,619 | 32.0 | |
| American Independent | Earl D. Wallen | 3,171 | 1.7 | |
| Total votes | 186,216 | 100.0 | ||
| Republican hold | ||||
1970
| Party | Candidate | Votes | % | |
|---|---|---|---|---|
| Republican | Jerry Pettis (Incumbent) | 116,093 | 72.2 | |
| Democratic | Chester M. Wright | 44,764 | 27.8 | |
| Total votes | 160,857 | 100.0 | ||
| Republican hold | ||||
1972
| Party | Candidate | Votes | % | |
|---|---|---|---|---|
| Republican | Jerry Pettis (Incumbent) | 140,304 | 75.1 | |
| Democratic | Ken Thompson | 46,626 | 24.9 | |
| Total votes | 186,930 | 100.0 | ||
| Republican hold | ||||
1974
| Party | Candidate | Votes | % | |
|---|---|---|---|---|
| Republican | Del M. Clawson (Incumbent) | 71,054 | 53.4 | |
| Democratic | Robert E. "Bob" White | 57,423 | 43.1 | |
| American Independent | James C. "Jim" Griffin | 4,636 | 3.5 | |
| Total votes | 133,113 | 100.0 | ||
| Republican hold | ||||
1976
| Party | Candidate | Votes | % | |
|---|---|---|---|---|
| Republican | Del M. Clawson (Incumbent) | 95,398 | 55.1 | |
| Democratic | Ted Snyder | 77,807 | 44.9 | |
| Total votes | 173,205 | 100.0 | ||
| Republican hold | ||||
1978
| Party | Candidate | Votes | % | |
|---|---|---|---|---|
| Republican | Wayne R. Grisham | 79,533 | 56.0 | |
| Democratic | Dennis S. Kazarian | 62,540 | 44.0 | |
| Total votes | 142,073 | 100.0 | ||
| Republican hold | ||||
1980
| Party | Candidate | Votes | % | |
|---|---|---|---|---|
| Republican | Wayne R. Grisham (Incumbent) | 122,439 | 70.9 | |
| Democratic | Fred L. Anderson | 50,365 | 29.1 | |
| Total votes | 172,804 | 100.0 | ||
| Republican hold | ||||
1982
| Party | Candidate | Votes | % | |
|---|---|---|---|---|
| Republican | David Dreier (Incumbent) | 112,362 | 65.2 | |
| Democratic | Paul Servelle | 55,514 | 32.2 | |
| Libertarian | Phillips B. Franklin | 2,251 | 1.3 | |
| Peace and Freedom | James Michael "Mike" Noonan | 2,223 | 1.3 | |
| Total votes | 172,350 | 100.0 | ||
| Republican hold | ||||
1984
| Party | Candidate | Votes | % | |
|---|---|---|---|---|
| Republican | David Dreier (Incumbent) | 147,363 | 70.6 | |
| Democratic | Claire K. McDonald | 54,147 | 26.0 | |
| Libertarian | Gail Lightfoot | 4,738 | 2.3 | |
| Peace and Freedom | James Michael "Mike" Noonan | 2,371 | 1.1 | |
| Total votes | 208,619 | 100.0 | ||
| Republican hold | ||||
1986
| Party | Candidate | Votes | % | |
|---|---|---|---|---|
| Republican | David Dreier (Incumbent) | 118,541 | 71.7 | |
| Democratic | Monty Hempel | 44,312 | 26.8 | |
| Peace and Freedom | James Michael "Mike" Noonan | 2,500 | 1.5 | |
| Total votes | 165,353 | 100.0 | ||
| Republican hold | ||||
1988
| Party | Candidate | Votes | % | |
|---|---|---|---|---|
| Republican | David Dreier (Incumbent) | 151,704 | 69.2 | |
| Democratic | Nelson Gentry | 57,586 | 26.2 | |
| Libertarian | Gail Lightfoot | 6,601 | 3.0 | |
| Peace and Freedom | James Michael "Mike" Noonan | 3,492 | 1.6 | |
| Total votes | 219,383 | 100.0 | ||
| Republican hold | ||||
1990
| Party | Candidate | Votes | % | |
|---|---|---|---|---|
| Republican | David Dreier (Incumbent) | 101,336 | 63.7 | |
| Democratic | Georgia Houston Webb | 49,981 | 31.4 | |
| Libertarian | Gail Lightfoot | 7,840 | 4.9 | |
| Total votes | 159,157 | 100.0 | ||
| Republican hold | ||||
1992
| Party | Candidate | Votes | % | |
|---|---|---|---|---|
| Democratic | Lucille Roybal-Allard | 32,010 | 63.0 | |
| Republican | Robert Guzman | 15,428 | 30.4 | |
| Peace and Freedom | Tim Delia | 2,135 | 4.2 | |
| Libertarian | Dale S. Olvera | 1,206 | 2.4 | |
| Total votes | 50,779 | 100.0 | ||
| Democratic hold | ||||
1994
| Party | Candidate | Votes | % | |
|---|---|---|---|---|
| Democratic | Lucille Roybal-Allard (Incumbent) | 33,814 | 81.5 | |
| Peace and Freedom | Kermit Booker | 7,694 | 18.5 | |
| Total votes | 41,508 | 100.0 | ||
| Democratic hold | ||||
1996
| Party | Candidate | Votes | % | |
|---|---|---|---|---|
| Democratic | Lucille Roybal-Allard (Incumbent) | 47,478 | 82.2 | |
| Republican | John Leonard | 8,147 | 14.0 | |
| Libertarian | Howard Johnson | 2,203 | 3.8 | |
| Total votes | 57,828 | 100.0 | ||
| Democratic hold | ||||
1998
| Party | Candidate | Votes | % | |
|---|---|---|---|---|
| Democratic | Lucille Roybal-Allard (Incumbent) | 43,310 | 87.2 | |
| Republican | Wayne Miller | 6,364 | 12.8 | |
| Total votes | 49,674 | 100.0 | ||
| Democratic hold | ||||
2000
| Party | Candidate | Votes | % | |
|---|---|---|---|---|
| Democratic | Lucille Roybal-Allard (Incumbent) | 60,510 | 84.6 | |
| Republican | Wayne Miller | 8,260 | 11.6 | |
| Libertarian | Nathan Thomas Craddock | 1,601 | 2.2 | |
| Natural Law | William Harpur | 1,200 | 1.6 | |
| Total votes | 71,571 | 100.0 | ||
| Democratic hold | ||||
2002
| Party | Candidate | Votes | % | |
|---|---|---|---|---|
| Democratic | Diane Watson (Incumbent) | 97,779 | 82.6 | |
| Republican | Andrew Kim | 16,699 | 14.1 | |
| Libertarian | Charles Tate | 3,971 | 3.3 | |
| Total votes | 118,449 | 100.0 | ||
| Democratic hold | ||||
2004
| Party | Candidate | Votes | % | |
|---|---|---|---|---|
| Democratic | Diane Watson (Incumbent) | 166,801 | 88.6 | |
| Libertarian | Robert G. Weber, Jr. | 21,513 | 11.4 | |
| Total votes | 188,314 | 100.0 | ||
| Democratic hold | ||||
2006
| Party | Candidate | Votes | % | |
|---|---|---|---|---|
| Democratic | Diane Watson (Incumbent) | 113,715 | 100.0 | |
| Democratic hold | ||||
2008
| Party | Candidate | Votes | % | |
|---|---|---|---|---|
| Democratic | Diane Watson (Incumbent) | 186,924 | 87.6 | |
| Republican | David Crowley | 26,536 | 12.4 | |
| Total votes | 213,460 | 100.0 | ||
| Turnout | 70.2 | |||
| Democratic hold | ||||
2010
| Party | Candidate | Votes | % | |
|---|---|---|---|---|
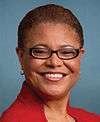
| Democratic | Karen Bass | 131,990 | 86.1 | |
| Republican | James L. Andion | 21,342 | 13.9 | |
| Total votes | 153,332 | 100.0 | ||
| Democratic hold | ||||
2012
| Party | Candidate | Votes | % | |
|---|---|---|---|---|
| Democratic | Henry Waxman (Incumbent) | 171,860 | 54.0 | |
| Independent | Bill Bloomfield | 146,660 | 46.0 | |
| Total votes | 318,520 | 100.0 | ||
| Democratic hold | ||||
2014
| Party | Candidate | Votes | % | |
|---|---|---|---|---|
| Democratic | Ted Lieu | 108,331 | 59.2 | |
| Republican | Elan Carr | 79,700 | 40.8 | |
| Total votes | 188,031 | 100.0 | ||
| Democratic hold | ||||
2016
| Party | Candidate | Votes | % | |
|---|---|---|---|---|
| Democratic | Ted Lieu (Incumbent) | 219,397 | 66.4 | |
| Republican | Kenneth W. Wright | 110,822 | 33.6 | |
| Total votes | 330,219 | 100.0 | ||
| Democratic hold | ||||
2018
| Party | Candidate | Votes | % | |
|---|---|---|---|---|
| Democratic | Ted Lieu (Incumbent) | 219,091 | 70.0 | |
| Republican | Kenneth W. Wright | 93,769 | 30.0 | |
| Total votes | 312,860 | 100.0 | ||
| Democratic hold | ||||
Historical district boundaries
From 2003 to 2013, the district encompassed the incorporated city of Culver City (a center of film and TV production), and in the Baldwin Hills unincorporated areas such as Ladera Heights, and some of the western neighborhoods within the city of Los Angeles such as Baldwin Hills (neighborhood).
From 1993 to 2013, large parts of the 33rd were in the California's 36th congressional district. The 36th was located in southwestern Los Angeles County and included Manhattan Beach, Torrance and portions of Los Angeles itself. This district was largely dismantled after the 2010 census with the 33rd succeeding the 36th while the current 36th is largely the successor of the old 45th District.
References
- US Census
- LA Times
- "Partisan Voting Index – Districts of the 115th Congress" (PDF). The Cook Political Report. April 7, 2017. Retrieved April 7, 2017.
- Elan Carr for Congress (2014)
- Statement of Vote (1990 Governor)
- Statement of Vote (1992 President)
- Statement of Vote (1992 Senate)
- Statement of Vote (1992 Senate)
- Statement of Vote (1994 Governor)
- Statement of Vote (1994 Senate)
- Statement of Vote (1996 President)
- Statement of Vote (1998 Governor) Archived September 29, 2011, at the Wayback Machine
- Statement of Vote (1998 Senate) Archived September 29, 2011, at the Wayback Machine
- Statement of Vote (2000 President)
- Statement of Vote (2000 Senator)
- Statement of Vote (2002 Governor)
- Statement of Vote (2003 Recall Question)
- Statement of Vote (2003 Governor)
- Statement of Vote (2004 President)
- Statement of Vote (2004 Senator)
- Statement of Vote (2006 Governor)
- Statement of Vote (2006 Senator)
- Statement of Vote (2008 President)
- Statement of Vote (2010 Governor)
- Statement of Vote (2010 Senator)
- Statement of Vote (2012 President)
- Statement of Vote (2012 Senator)
- Statement of Vote (2014 Governor)
- Statement of Vote (2016 President)
- Statement of Vote (2016 Senator)
- Statement of Vote (2018 Governor)
- Statement of Vote (2018 Senator)
- 1962 election results
- 1964 election results
- 1966 election results
- 1968 election results
- 1970 election results
- 1972 election results
- 1974 election results
- 1976 election results
- 1978 election results
- 1980 election results
- 1982 election results
- 1984 election results
- 1986 election results
- 1988 election results
- 1990 election results
- 1992 election results
- 1994 election results
- 1996 election results
- 1998 election results
- 2000 election results
- 2002 election results
- 2004 election results
- 2006 election results
- 2008 election results
- 2010 election results
- 2012 election results
- 2014 election results
- 2016 election results
- 2018 election results
Further reading
- Mark Leibovich (April 24, 2014), "Real House Candidates of Beverly Hills", New York Times