California's 20th congressional district
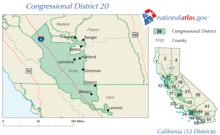
California's 20th congressional district is a congressional district in the U.S. state of California. It encompasses much of the Central Coast region. The district includes Monterey and San Benito counties, most of Santa Cruz County, and portions of Santa Clara County.
| California's 20th congressional district | |||
|---|---|---|---|
.tif.png) California's 20th congressional district – since January 3, 2013. | |||
| Representative |
| ||
| Median income | $75,460[1] | ||
| Ethnicity | |||
| Cook PVI | D+23[3] | ||
The district is currently represented by Jimmy Panetta.
Prior to redistricting in 2011, the 20th district was located in the San Joaquin Valley. It covered Kings County and portions of Fresno and Kern counties, including most of the city of Fresno. That area is now largely divided between the 21st and 16th districts, while most of the current 20th was within the former 17th.
Voting
| Election results from statewide races | ||
|---|---|---|
| Year | Office | Results |
| 2018 | Governor | Newsom 70.2 - 29.8% |
| Senator | Feinstein 54.2 - 45.8% | |
| 2016 | President | Clinton 70.4 – 23.2% |
| Senator | Harris 66.2 - 33.8% | |
| 2014 | Governor | Brown 73.0 - 27.0% |
| 2012 | President | Obama 70.9 – 26.2% |
| Senator | Feinstein 73.1 - 26.9% | |
| 2010 | Governor | Brown 55.9 – 37.1% |
| Senator | Boxer 48.3 – 43.5% | |
| 2008 | President[4] | Obama 59.6 – 38.7% |
| 2006 | Governor[5] | Schwarzenegger 53.7 – 41.5% |
| Senator[6] | Feinstein 60.5 – 33.9% | |
| 2004 | President[7] | Kerry 50.6 – 48.5% |
| Senator[8] | Boxer 57.2 – 38.3% | |
| 2003 | Recall[9][10] | Yes 50.0 – 41.0% |
| Schwarzenegger 42.7 – 40.4% | ||
| 2002 | Governor[11] | Davis 53.1 – 40.6% |
| 2000 | President[12] | Gore 49.6 – 47.6% |
| Senator[13] | Feinstein 58.4 – 35.0% | |
| 1998 | Governor | |
| Senator | ||
| 1996 | President | |
| 1994 | Governor | |
| Senator | ||
| 1992 | President | Clinton 46.9 – 37.5% |
| Senator | Herschensohn 50.2 – 40.1% | |
| Senator | Feinstein 47.4 – 44.9% | |
List of representatives
| Representative | Party | Dates | Cong ress(es) |
Notes | Counties |
|---|---|---|---|---|---|
| District created | March 4, 1933 | ||||
 |
Republican | March 4, 1933 – January 3, 1937 |
73rd 74th |
Retired | Imperial, San Diego |
 |
Democratic | January 3, 1937 – January 3, 1943 |
75th 76th 77th |
Redistricted to the 23rd district | |
 |
Republican | January 3, 1943 – August 5, 1956 |
78th 79th 80th 81st 82nd 83rd 84th |
Redistricted from the 11th district Died |
Los Angeles |
| Vacant | August 5, 1956 – January 3, 1957 |
||||
 |
Republican | January 3, 1957 – January 3, 1973 |
85th 86th 87th 88th 89th 90th 91st 92nd |
Retired | |
 |
Republican | January 3, 1973 – January 3, 1975 |
93rd | Redistricted to the 22nd district | |
 |
Republican | January 3, 1975 – January 3, 1983 |
94th 95th 96th 97th |
Redistricted from the 27th district Retired to run for US Senate |
Southwestern Los Angeles, eastern Ventura |
 |
Republican | January 3, 1983 – January 3, 1993 |
98th 99th 100th 101st 102nd |
Redistricted from the 18th district Redistricted to the 21st district |
Inyo, Kern, Los Angeles (Lancaster), San Luis Obispo |
 |
Democratic | January 3, 1993 – January 3, 2003 |
103rd 104th 105th 106th 107th |
Redistricted from the 17th district | Western Fresno, northwestern Kern, Kings, western Tulare |
| January 3, 2003 – January 3, 2005 |
108th | Retired | Western Fresno, northwestern Kern, Kings | ||
.jpg) |
Democratic | January 3, 2005 – January 3, 2013 |
109th 110th 111th 112th |
Redistricted to the 16th district | |
 |
Democratic | January 3, 2013 – January 3, 2017 |
113th 114th |
Redistricted from the 17th district Retired |
Monterey and San Benito, and portions of Santa Clara and Santa Cruz |
 |
Democratic | January 3, 2017 – present |
115th 116th |
||
Election results
|
1932 • 1934 • 1936 • 1938 • 1940 • 1942 • 1944 • 1946 • 1948 • 1950 • 1952 • 1954 • 1956 • 1958 • 1960 • 1962 • 1964 • 1966 • 1968 • 1970 • 1972 • 1974 • 1976 • 1978 • 1980 • 1982 • 1984 • 1986 • 1988 • 1990 • 1992 • 1994 • 1996 • 1998 • 2000 • 2002 • 2004 • 2006 • 2008 • 2010 • 2012 • 2014 • 2016 • 2018 |
1932
| Party | Candidate | Votes | % | |
|---|---|---|---|---|
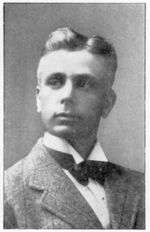
| Republican | George Burnham (incumbent) | 43,757 | 50.3 | |
| Democratic | Claude Chandler | 43,304 | 49.7 | |
| Total votes | 87,061 | 100.0 | ||
| Turnout | ||||
| Republican hold | ||||
1934
| Party | Candidate | Votes | % | |
|---|---|---|---|---|
| Republican | George Burnham (incumbent) | 51,682 | 52.4 | |
| Democratic | Edouard Izac | 46,957 | 47.6 | |
| Total votes | 98,639 | 100.0 | ||
| Turnout | ||||
| Republican hold | ||||
1936
| Party | Candidate | Votes | % | |||
|---|---|---|---|---|---|---|
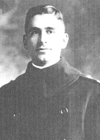
| Democratic | Edouard Izac | 59,208 | 56.4 | |||
| Republican | Ed P. Simple | 44,925 | 42.8 | |||
| Communist | Esco L. Richardson | 916 | 0.8 | |||
| Total votes | 105,049 | 100.0 | ||||
| Turnout | ||||||
| Democratic gain from Republican | ||||||
1938
| Party | Candidate | Votes | % | |
|---|---|---|---|---|
| Democratic | Edouard Izac (incumbent) | 65,243 | 60.4 | |
| Republican | John L. Bacon | 42,710 | 39.6 | |
| Total votes | 107,953 | 100.0 | ||
| Turnout | ||||
| Democratic hold | ||||
1940
| Party | Candidate | Votes | % | |
|---|---|---|---|---|
| Democratic | Edouard Izac (incumbent) | 69,874 | 51.1 | |
| Republican | John L. Bacon | 66,132 | 48.3 | |
| Communist | Esco L. Richardson | 806 | 0.6 | |
| Total votes | 136,812 | 100.0 | ||
| Turnout | ||||
| Democratic hold | ||||
1942
| Party | Candidate | Votes | % | |
|---|---|---|---|---|
| Republican | John Carl Hinshaw (inc.) | 62,628 | 48.4 | |
| Democratic | Joseph O. Donovan | 55,479 | 42.9 | |
| Prohibition | Virgil G. Hinshaw | 6,864 | 5.3 | |
| Townsend | Janie Bele McCarty | 3,537 | 2.7 | |
| Communist | Orla E. Lair | 792 | 0.6 | |
| Total votes | 129,300 | 100.0 | ||
| Turnout | ||||
| Republican hold | ||||
1944
| Party | Candidate | Votes | % | |
|---|---|---|---|---|
| Republican | John Carl Hinshaw (inc.) | 112,663 | 51.8 | |
| Democratic | Archibald B. Young | 101,090 | 46.5 | |
| Prohibition | Charles Hiram Randall | 3,615 | 1.5 | |
| Total votes | 217,368 | 100.0 | ||
| Turnout | ||||
| Republican hold | ||||
1946
| Party | Candidate | Votes | % | |
|---|---|---|---|---|
| Republican | John Carl Hinshaw (inc.) | 98,283 | 63.2 | |
| Democratic | Everett G. Burkhalter | 67,317 | 36.8 | |
| Total votes | 165,600 | 100.0 | ||
| Turnout | ||||
| Republican hold | ||||
1948
| Party | Candidate | Votes | % | |
|---|---|---|---|---|
| Republican | John Carl Hinshaw (inc.) | 204,710 | 81.6 | |
| Democratic | William B. Esterman | 46,232 | 18.4 | |
| Total votes | 250,942 | 100.0 | ||
| Turnout | ||||
| Republican hold | ||||
1950
| Party | Candidate | Votes | % | |
|---|---|---|---|---|
| Republican | John Carl Hinshaw (inc.) | 211,012 | 85.1 | |
| Progressive | Myra Tanner Weiss | 26,508 | 10.7 | |
| Prohibition | Frank Nelson | 10,339 | 4.2 | |
| Total votes | 247,859 | 100.0 | ||
| Turnout | ||||
| Republican hold | ||||
1952
| Party | Candidate | Votes | % | |
|---|---|---|---|---|
| Republican | John Carl Hinshaw (inc.) | 109,509 | 100.0 | |
| Turnout | ||||
| Republican hold | ||||
1954
| Party | Candidate | Votes | % | |
|---|---|---|---|---|
| Republican | John Carl Hinshaw (inc.) | 71,213 | 71.2 | |
| Democratic | Eugene Radding | 28,838 | 28.8 | |
| Total votes | 100,051 | 100.0 | ||
| Turnout | ||||
| Republican hold | ||||
1956
| Party | Candidate | Votes | % | |
|---|---|---|---|---|
| Republican | H. Allen Smith | 85,459 | 70.8 | |
| Democratic | Eugene Radding | 35,249 | 29.2 | |
| Total votes | 120,708 | 100.0 | ||
| Turnout | ||||
| Republican hold | ||||
1958
| Party | Candidate | Votes | % | |
|---|---|---|---|---|
| Republican | H. Allen Smith (incumbent) | 72,311 | 66 | |
| Democratic | Eugene Radding | 37,331 | 34 | |
| Total votes | 109,642 | 100.0 | ||
| Turnout | ||||
| Republican hold | ||||
1960
| Party | Candidate | Votes | % | |
|---|---|---|---|---|
| Republican | H. Allen Smith (incumbent) | 90,214 | 70.1 | |
| Democratic | Eugene Radding | 38,497 | 29.9 | |
| Total votes | 128,711 | 100.0 | ||
| Turnout | ||||
| Republican hold | ||||
1962
| Party | Candidate | Votes | % | |
|---|---|---|---|---|
| Republican | H. Allen Smith (incumbent) | 119,938 | 70.6 | |
| Democratic | Leon Mayer | 49,850 | 29.4 | |
| Total votes | 169,788 | 100.0 | ||
| Turnout | ||||
| Republican hold | ||||
1964
| Party | Candidate | Votes | % | |
|---|---|---|---|---|
| Republican | H. Allen Smith (incumbent) | 132,402 | 67.9 | |
| Democratic | C. Bernard Kaufman | 62,645 | 32.1 | |
| Total votes | 195,047 | 100.0 | ||
| Turnout | ||||
| Republican hold | ||||
1966
| Party | Candidate | Votes | % | |
|---|---|---|---|---|
| Republican | H. Allen Smith (incumbent) | 128,896 | 73.4 | |
| Democratic | Raymond Freschi | 46,730 | 26.6 | |
| Total votes | 175,626 | 100.0 | ||
| Turnout | ||||
| Republican hold | ||||
1968
| Party | Candidate | Votes | % | |
|---|---|---|---|---|
| Republican | H. Allen Smith (incumbent) | 133,148 | 69.3 | |
| Democratic | Don White | 56,008 | 29.2 | |
| Peace and Freedom | Robert J. Clarke | 2,965 | 1.5 | |
| Total votes | 192,121 | 100.0 | ||
| Turnout | ||||
| Republican hold | ||||
1970
| Party | Candidate | Votes | % | |
|---|---|---|---|---|
| Republican | H. Allen Smith (incumbent) | 116,437 | 69.1 | |
| Democratic | Michael M. Stolzberg | 50,033 | 29.7 | |
| American Independent | Earl C. Harper | 2,100 | 1.2 | |
| Total votes | 168,570 | 100.0 | ||
| Turnout | ||||
| Republican hold | ||||
1972
| Party | Candidate | Votes | % | |
|---|---|---|---|---|
| Republican | Carlos Moorhead | 120,299 | 57.4 | |
| Democratic | John Binkley | 89,219 | 42.6 | |
| Total votes | 209,518 | 100.0 | ||
| Turnout | ||||
| Republican hold | ||||
1974
| Party | Candidate | Votes | % | |
|---|---|---|---|---|
| Republican | Barry Goldwater, Jr. (inc.) | 96,324 | 61.2 | |
| Democratic | Arline M. Mathews | 61,119 | 38.8 | |
| Total votes | 157,443 | 100.0 | ||
| Turnout | ||||
| Republican hold | ||||
1976
| Party | Candidate | Votes | % | |
|---|---|---|---|---|
| Republican | Barry Goldwater, Jr. (inc.) | 146,158 | 67.2 | |
| Democratic | Patty Lear Corman | 71,193 | 32.8 | |
| Total votes | 217,351 | 100.0 | ||
| Turnout | ||||
| Republican hold | ||||
1978
| Party | Candidate | Votes | % | |
|---|---|---|---|---|
| Republican | Barry Goldwater, Jr. (inc.) | 129,714 | 66.4 | |
| Democratic | Pat Lear | 65,695 | 33.6 | |
| Total votes | 195,409 | 100.0 | ||
| Turnout | ||||
| Republican hold | ||||
1980
| Party | Candidate | Votes | % | |
|---|---|---|---|---|
| Republican | Barry Goldwater, Jr. (inc.) | 199,674 | 78.8 | |
| Democratic | Matt Miller | 43,024 | 17.0 | |
| Libertarian | Christopher R. Darwin | 10,605 | 4.2 | |
| Total votes | 253,303 | 100.0 | ||
| Turnout | ||||
| Republican hold | ||||
1982
| Party | Candidate | Votes | % | |
|---|---|---|---|---|
| Republican | Bill Thomas (incumbent) | 123,312 | 68.1 | |
| Democratic | Robert J. Bethea | 57,769 | 31.9 | |
| Total votes | 181,081 | 100.0 | ||
| Turnout | ||||
| Republican hold | ||||
1984
| Party | Candidate | Votes | % | |
|---|---|---|---|---|
| Republican | Bill Thomas (incumbent) | 151,732 | 70.9 | |
| Democratic | Michael T. LeSage | 62,307 | 29.1 | |
| Total votes | 214,039 | 100.0 | ||
| Turnout | ||||
| Republican hold | ||||
1986
| Party | Candidate | Votes | % | |
|---|---|---|---|---|
| Republican | Bill Thomas (incumbent) | 129,989 | 72.6 | |
| Democratic | Jules H. Moquin | 49,027 | 27.4 | |
| Total votes | 179,016 | 100.0 | ||
| Turnout | ||||
| Republican hold | ||||
1988
| Party | Candidate | Votes | % | |
|---|---|---|---|---|
| Republican | Bill Thomas (incumbent) | 162,779 | 71.1 | |
| Democratic | Lita Reid | 62,037 | 27.1 | |
| Libertarian | David L. Bersohn | 4,190 | 1.8 | |
| Total votes | 229,006 | 100.0 | ||
| Turnout | ||||
| Republican hold | ||||
1990
| Party | Candidate | Votes | % | |
|---|---|---|---|---|
| Republican | Bill Thomas (incumbent) | 112,962 | 59.8 | |
| Democratic | Michael A. Thomas | 65,101 | 34.5 | |
| Libertarian | William Howard Dilbeck | 10,555 | 5.6 | |
| No party | Reid (write-in) | 307 | 0.2 | |
| Total votes | 188,925 | 100.0 | ||
| Turnout | ||||
| Republican hold | ||||
1992
| Party | Candidate | Votes | % | |
|---|---|---|---|---|
| Democratic | Cal Dooley (incumbent) | 72,679 | 64.9 | |
| Republican | Ed Hunt | 39,388 | 35.1 | |
| Total votes | 112,067 | 100.0 | ||
| Turnout | ||||
| Democratic hold | ||||
1994
| Party | Candidate | Votes | % | |
|---|---|---|---|---|
| Democratic | Cal Dooley (incumbent) | 57,394 | 56.70 | |
| Republican | Paul Young | 43,836 | 43.30 | |
| Total votes | 101,230 | 100.0 | ||
| Turnout | ||||
| Democratic hold | ||||
1996
| Party | Candidate | Votes | % | |
|---|---|---|---|---|
| Democratic | Cal Dooley (incumbent) | 65,381 | 56.6% | |
| Republican | Trice Harvey | 45,276 | 39.1% | |
| Libertarian | Jonathan Richter | 5,048 | 4.3% | |
| Total votes | 115,705 | 100.0% | ||
| Turnout | ||||
| Democratic hold | ||||
1998
| Party | Candidate | Votes | % | |
|---|---|---|---|---|
| Democratic | Cal Dooley (incumbent) | 60,599 | 60.73% | |
| Republican | Cliff Unruh | 39,183 | 39.27% | |
| Total votes | 99,782 | 100.0% | ||
| Turnout | ||||
| Democratic hold | ||||
2000
| Party | Candidate | Votes | % | |
|---|---|---|---|---|
| Democratic | Cal Dooley (incumbent) | 66,235 | 52.4% | |
| Republican | Rich Rodriguez | 57,563 | 45.5% | |
| Natural Law | Walter Kenneth Ruehlig | 1,416 | 1.1% | |
| Libertarian | Arnold Kriegbaum | 1,320 | 1.0% | |
| Total votes | 126,534 | 100.0% | ||
| Turnout | ||||
| Democratic hold | ||||
2002
| Party | Candidate | Votes | % | |
|---|---|---|---|---|
| Democratic | Cal Dooley (incumbent) | 47,627 | 63.7 | |
| Republican | Andre Minuth | 25,628 | 34.3 | |
| Libertarian | Varrin Swearingen | 1,515 | 2.0 | |
| Turnout | 74,770 | |||
| Democratic hold | ||||
2004
| Party | Candidate | Votes | % | |
|---|---|---|---|---|
| Democratic | Jim Costa | 61,005 | 53.5 | |
| Republican | Roy Ashburn | 53,231 | 46.5 | |
| Total votes | 114,236 | 100.0 | ||
| Turnout | ||||
| Democratic hold | ||||
2006
| Party | Candidate | Votes | % | |
|---|---|---|---|---|
| Democratic | Jim Costa (incumbent) | 61,120 | 100.0 | |
| Turnout | ||||
| Democratic hold | ||||
2008
| Party | Candidate | Votes | % | |
|---|---|---|---|---|
| Democratic | Jim Costa (incumbent) | 93,023 | 74.33 | |
| Republican | Jim Lopez | 32,118 | 25.67 | |
| Total votes | 125,141 | 100.0 | ||
| Turnout | 60.55% | |||
| Democratic hold | ||||
2010
| Party | Candidate | Votes | % | |
|---|---|---|---|---|
| Democratic | Jim Costa (incumbent) | 46,247 | 51.71 | |
| Republican | Andy Vidak | 43,197 | 48.29 | |
| Total votes | 89,444 | 100.00 | ||
| Turnout | ||||
| Democratic hold | ||||
2012
| Party | Candidate | Votes | % | |
|---|---|---|---|---|
| Democratic | Sam Farr (incumbent) | 172,996 | 74.1 | |
| Republican | Jeff Taylor | 60,566 | 25.9 | |
| Total votes | 233,562 | 100.0 | ||
| Democratic hold | ||||
2014
| Party | Candidate | Votes | % | |
|---|---|---|---|---|
| Democratic | Sam Farr (incumbent) | 106,034 | 75.2 | |
| Republican | Ronald Paul Kabat | 35,010 | 24.8 | |
| Total votes | 141,044 | 100.0 | ||
| Democratic hold | ||||
2016
| Party | Candidate | Votes | % | |
|---|---|---|---|---|
| Democratic | Jimmy Panetta | 180,980 | 70.8 | |
| Republican | Casey Lucius | 74,811 | 29.2 | |
| Total votes | 255,791 | 100.0 | ||
| Democratic hold | ||||
2018
| Party | Candidate | Votes | % | |
|---|---|---|---|---|
| Democratic | Jimmy Panetta (incumbent) | 183,677 | 81.4 | |
| No party preference | Ronald Paul Kabat | 42,044 | 18.6 | |
| Total votes | 225,721 | 100.0 | ||
| Democratic hold | ||||
Historical district boundaries
References
- https://www.census.gov/mycd/?st=06&cd=20
- "Citizens Redistricting Commission Final Report, 2011" (PDF).
- "Partisan Voting Index – Districts of the 115th Congress" (PDF). The Cook Political Report. April 7, 2017. Retrieved April 7, 2017.
- "(2008 President)". Archived from the original on 2009-02-11. Retrieved 2009-03-05.
- Statement of Vote (2006 Governor) Archived 2011-08-10 at the Wayback Machine
- Statement of Vote (2006 Senator) Archived 2011-08-10 at the Wayback Machine
- "Statement of Vote (2004 President)" (PDF). Archived from the original (PDF) on 2011-05-20. Retrieved 2007-08-08.
- Statement of Vote (2004 Senator) Archived 2011-08-10 at the Wayback Machine
- "Statement of Vote (2003 Recall Question)" (PDF). Archived from the original (PDF) on 2011-05-20. Retrieved 2007-10-08.
- "Statement of Vote (2003 Governor)" (PDF). Archived from the original (PDF) on 2011-05-20. Retrieved 2007-10-08.
- Statement of Vote (2002 Governor) Archived 2010-11-11 at the Wayback Machine
- "Statement of Vote (2000 President)" (PDF). Archived from the original (PDF) on 2011-05-20. Retrieved 2008-09-17.
- "Statement of Vote (2000 Senator)" (PDF). Archived from the original (PDF) on 2011-05-20. Retrieved 2008-09-17.
- 1932 election results
- 1934 election results
- 1936 election results
- 1938 election results
- 1940 election results
- 1942 election results
- 1944 election results
- 1946 election results
- 1948 election results
- 1950 election results
- 1952 election results
- 1954 election results
- 1956 election results
- 1958 election results
- 1960 election results
- 1962 election results
- 1964 election results
- 1966 election results
- 1968 election results
- 1970 election results
- 1972 election results
- 1974 election results
- 1976 election results
- 1978 election results
- 1980 election results
- 1982 election results
- 1984 election results
- 1986 election results
- 1988 election results
- 1990 election results
- 1992 election results
- 1994 election results
- 1996 election results
- 1998 election results
- 2000 election results
- 2002 general election results Archived February 3, 2009, at the Wayback Machine
- 2004 general election results Archived 2008-08-21 at the Wayback Machine
- 2006 general election results Archived November 27, 2008, at the Wayback Machine
- 2008 general election results
- "2010 general election results" (PDF). Archived from the original (PDF) on 2011-05-20. Retrieved 2012-03-08.
- 2012 general election results Archived October 19, 2013, at the Wayback Machine
- "U.S. House of Representatives District 20 - Districtwide Results". Archived from the original on 2015-01-06. Retrieved 2014-12-21.
- "U.S. House of Representatives District 20 - Districtwide Results". Archived from the original on 2015-01-06. Retrieved 2014-12-21.
- "United States Representative in Congress by District" (PDF). Retrieved 2019-03-18.