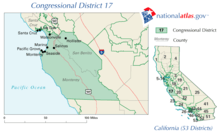
California's 17th congressional district
California's 17th congressional district is a congressional district in the U.S. state of California that is currently represented by Ro Khanna. It is located in the South Bay and East Bay regions of the San Francisco Bay Area. The district includes parts of Alameda County and Santa Clara County. It encompasses the cities of Sunnyvale, Cupertino, Santa Clara, Milpitas, Newark, the majority of Fremont, and the northernmost part of San Jose. The district includes the campus of Santa Clara University and the corporate headquarters of Apple Inc, Intel Corp., and Yahoo. It is the only majority-Asian district in the United States outside of Hawaii. From 2003 to 2013, the district covered all of Monterey and San Benito counties, as well as part of Santa Cruz County. It included all of the coastal communities surrounding Monterey Bay, the city of Salinas, and the vast majority of the Salinas Valley.
| California's 17th congressional district | |||
|---|---|---|---|
.tif.png) California's 17th congressional district since 2013 | |||
| Representative |
| ||
| Median income | $141,217[1] | ||
| Ethnicity | |||
| Cook PVI | D+25[3] | ||
Recent results from statewide elections
| Year | Office | Results |
|---|---|---|
| 1992 | President | Clinton 52.7 – 27.3% |
| Senator | Boxer 54.3 – 35.8% | |
| Senator | Feinstein 63.2 – 30.5% | |
| 1994 | Governor[4] | Wilson 48.2 – 47.3% |
| Senator[5] | Feinstein 51.1 – 38.8% | |
| 1996 | President[6] | Clinton 55.3 – 32.3% |
| 1998 | Governor[7] | Davis 62.6 – 32.5% |
| Senator[8] | Boxer 57.7 – 37.9% | |
| 2000 | President[9] | Gore 59.6 – 33.0% |
| Senator[10] | Feinstein 58.3 – 32.5% | |
| 2002 | Governor[11] | Davis 55.4 – 32.3% |
| 2003 | Recall[12][13] | No 57.8 – 42.2% |
| Bustamante 40.0 – 37.8% | ||
| 2004 | President[14] | Kerry 65.6 – 33.0% |
| Senator[15] | Boxer 66.0 – 28.9% | |
| 2006 | Governor[16] | Schwarzenegger 48.1 – 44.6% |
| Senator[17] | Feinstein 68.8 – 24.8% | |
| 2008 | President[18] | Obama 72.1 – 25.8% |
| 2010 | Governor | Brown 63.8 – 31.3% |
| Senator | Boxer 62.7 – 31.3% | |
| 2012 | President | Obama 71.9 – 25.5% |
| Senator | Feinstein 74.8 – 25.2% | |
| 2014 | Governor | Brown 74.6 – 25.4% |
| 2016 | President | Clinton 73.9 – 20.5% |
| Senator | Harris 68.0 – 32.0% | |
| 2018 | Governor | Newsom 71.5 – 28.5% |
| Senator | Feinstein 60.3 – 39.7% |
List of members representing the district
| Representative | Party | Dates | Cong ress(es) |
Electoral history | Counties |
|---|---|---|---|---|---|
| District created | March 4, 1933 | ||||
| Charles J. Colden | Democratic | March 4, 1933 – April 15, 1938 |
73rd 74th 75th |
Died | Los Angeles |
| Vacant | April 15, 1938 – January 3, 1939 |
||||
.jpg) Lee E. Geyer |
Democratic | January 3, 1939 – October 11, 1941 |
76th 77th |
Died | |
| Vacant | October 11, 1941 – August 25, 1942 |
||||
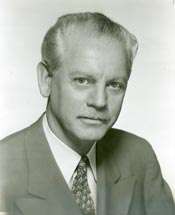 Cecil R. King |
Democratic | August 25, 1942 – January 3, 1969 |
77th 78th 79th 80th 81st 82nd 83rd 84th 85th 86th 87th 88th 89th 90th |
Retired | |
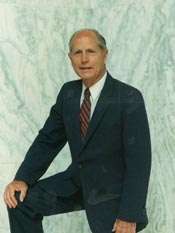 Glenn M. Anderson |
Democratic | January 3, 1969 – January 3, 1973 |
91st 92nd |
Redistricted to the 35th district | |
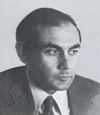
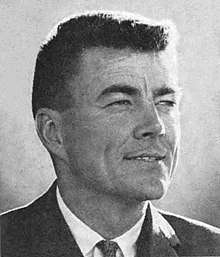 Pete McCloskey |
Republican | January 3, 1973 – January 3, 1975 |
93rd | Redistricted from the 11th district Redistricted to the 12th district |
Southern San Mateo, small part of northwestern Santa Clara |
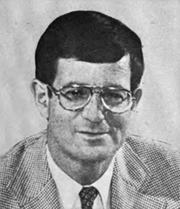 John Hans Krebs |
Democratic | January 3, 1975 – January 3, 1979 |
94th 95th |
Lost re-election | Eastern Fresno, Kings, northwestern Tulare |
 Charles (Chip) Pashayan |
Republican | January 3, 1979 – January 3, 1983 |
96th 97th |
||
| January 3, 1983 – January 3, 1991 |
98th 99th 100th 101st |
Lost re-election to Dooley | Eastern Fresno, Kings, Kern (Bakersfield), Tulare | ||
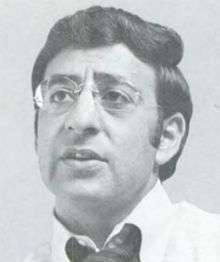
 Cal Dooley |
Democratic | January 3, 1991 – January 3, 1993 |
102nd | Redistricted to the 20th district | |
 Leon Panetta |
Democratic | January 3, 1993 – January 23, 1993 |
103rd | Redistricted from the 16th district Appointed Director of the OMB |
Monterey, San Benito, southern Santa Cruz |
| Vacant | January 23, 1993 – June 8, 1993 |
||||
 Sam Farr |
Democratic | June 8, 1993 – January 3, 2013 |
103rd 104th 105th 106th 107th 108th 109th 110th 111th 112th |
Redistricted to the 20th district | |
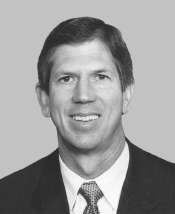
 Mike Honda |
Democratic | January 3, 2013 – January 3, 2017 |
113th 114th |
Redistricted from the 15th district. Lost re-election. |
Southern Alameda, western Santa Clara |
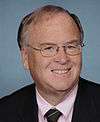
 Ro Khanna |
Democratic | January 3, 2017 – Present |
115th 116th |
||
Election results
|
1932 • 1934 • 1936 • 1938 • 1940 • 1942 (Special) • 1942 • 1944 • 1946 • 1948 • 1950 • 1952 • 1954 • 1956 • 1958 • 1960 • 1962 • 1964 • 1966 • 1968 • 1970 • 1972 • 1974 • 1976 • 1978 • 1980 • 1982 • 1984 • 1986 • 1988 • 1990 • 1992 • 1993 (Special) • 1994 • 1996 • 1998 • 2000 • 2002 • 2004 • 2006 • 2008 • 2010 • 2012 • 2014 • 2016 • 2018 |
1932
| Party | Candidate | Votes | % | ||
|---|---|---|---|---|---|
| Democratic | Charles J. Colden | 50,720 | 62.2 | ||
| Republican | A. E. Henning | 26,868 | 32.9 | ||
| Liberty | Ernest E. Debs | 3,965 | 4.9 | ||
| Total votes | 81,553 | 100.0 | |||
| Turnout | |||||
| Democratic win (new seat) | |||||
1934
| Party | Candidate | Votes | % | |
|---|---|---|---|---|
| Democratic | Charles J. Colden (incumbent) | 60,045 | 70.4 | |
| Republican | C. P. "Cap" Wright | 20,508 | 24.0 | |
| Socialist | Richard Pomeroy | 4,721 | 5.6 | |
| Total votes | 85,274 | 100.0 | ||
| Turnout | ||||
| Democratic hold | ||||
1936
| Party | Candidate | Votes | % | |
|---|---|---|---|---|
| Democratic | Charles J. Colden (incumbent) | 68,189 | 71.9 | |
| Republican | Leonard Roach | 24,981 | 26.3 | |
| Communist | John L. Leech | 1,634 | 1.8 | |
| Total votes | 94,804 | 100.0 | ||
| Turnout | ||||
| Democratic hold | ||||
1938
| Party | Candidate | Votes | % | |
|---|---|---|---|---|
| Democratic | Lee E. Geyer (incumbent) | 56,513 | 58.8 | |
| Republican | Clifton A. Hix | 26,891 | 28.0 | |
| Townsend | Fred C. Wagner | 8,870 | 9.2 | |
| Progressive | Robert O. Bates | 3,774 | 3.9 | |
| Total votes | 96,048 | 100.0 | ||
| Turnout | ||||
| Democratic hold | ||||
1940
| Party | Candidate | Votes | % | |
|---|---|---|---|---|
| Democratic | Lee E. Geyer (incumbent) | 75,109 | 65.5 | |
| Republican | Clifton A. Hix | 32,862 | 28.6 | |
| Progressive | Samuel C. Converse | 5,649 | 4.9 | |
| Communist | Harry L. Gray | 1,118 | 1.0 | |
| Total votes | 114,738 | 100.0 | ||
| Turnout | ||||
| Democratic hold | ||||
1942 (Special)
Democrat Cecil R. King won the special election to replace fellow Democrat Lee E. Geyer, who died in office. Data for this special election is not available.[24]
1942
| Party | Candidate | Votes | % | |
|---|---|---|---|---|
| Democratic | Cecil R. King (incumbent) | 92,260 | 100.0 | |
| Turnout | ||||
| Democratic hold | ||||
1944
| Party | Candidate | Votes | % | |
|---|---|---|---|---|
| Democratic | Cecil R. King (incumbent) | 147,217 | 100.0 | |
| Turnout | ||||
| Democratic hold | ||||
1946
| Party | Candidate | Votes | % | |
|---|---|---|---|---|
| Democratic | Cecil R. King (incumbent) | 110,654 | 100.0 | |
| Turnout | ||||
| Democratic hold | ||||
1948
| Party | Candidate | Votes | % | |
|---|---|---|---|---|
| Democratic | Cecil R. King (incumbent) | 194,782 | 100.0 | |
| Turnout | ||||
| Democratic hold | ||||
1950
| Party | Candidate | Votes | % | |
|---|---|---|---|---|
| Democratic | Cecil R. King (incumbent) | 166,334 | 100.0 | |
| Turnout | ||||
| Democratic hold | ||||
1952
| Party | Candidate | Votes | % | |
|---|---|---|---|---|
| Democratic | Cecil R. King (incumbent) | 114,650 | 54.6 | |
| Republican | Robert H. Finch | 92,587 | 44.1 | |
| Progressive | Loyd C. Seelinger | 2,738 | 1.3 | |
| Total votes | 209,975 | 100.0 | ||
| Turnout | ||||
| Democratic hold | ||||
1954
| Party | Candidate | Votes | % | |
|---|---|---|---|---|
| Democratic | Cecil R. King (incumbent) | 97,828 | 60.1 | |
| Republican | Robert H. Finch | 64,967 | 39.9 | |
| Total votes | 162,795 | 100.0 | ||
| Turnout | ||||
| Democratic hold | ||||
1956
| Party | Candidate | Votes | % | |
|---|---|---|---|---|
| Democratic | Cecil R. King (incumbent) | 157,270 | 64.9 | |
| Republican | Charles A. Franklin | 84,900 | 35.1 | |
| Total votes | 242,170 | 100.0 | ||
| Turnout | ||||
| Democratic hold | ||||
1958
| Party | Candidate | Votes | % | |
|---|---|---|---|---|
| Democratic | Cecil R. King (incumbent) | 182,965 | 75.3 | |
| Republican | Charles A. Franklin | 59,973 | 24.7 | |
| Total votes | 242,938 | 100.0 | ||
| Turnout | ||||
| Democratic hold | ||||
1960
| Party | Candidate | Votes | % | |
|---|---|---|---|---|
| Democratic | Cecil R. King (incumbent) | 206,620 | 67.7 | |
| Republican | Tom Coffee | 98,510 | 32.3 | |
| Total votes | 305,130 | 100.0 | ||
| Turnout | ||||
| Democratic hold | ||||
1962
| Party | Candidate | Votes | % | |
|---|---|---|---|---|
| Democratic | Cecil R. King (incumbent) | 74,964 | 73.8 | |
| Republican | Ted Bruinsma | 36,663 | 26.2 | |
| Total votes | 111,627 | 100.0 | ||
| Turnout | ||||
| Democratic hold | ||||
1964
| Party | Candidate | Votes | % | |
|---|---|---|---|---|
| Democratic | Cecil R. King (incumbent) | 95,640 | 67.7 | |
| Republican | Robert Muncaster | 45,688 | 32.3 | |
| Total votes | 141,328 | 100.0 | ||
| Turnout | ||||
| Democratic hold | ||||
1966
| Party | Candidate | Votes | % | |
|---|---|---|---|---|
| Democratic | Cecil R. King (incumbent) | 76,962 | 60.8 | |
| Republican | Don Cortum | 49,615 | 39.2 | |
| Total votes | 126,577 | 100.0 | ||
| Turnout | ||||
| Democratic hold | ||||
1968
| Party | Candidate | Votes | % | |
|---|---|---|---|---|
| Democratic | Glenn M. Anderson | 75,070 | 50.7 | |
| Republican | Joe Blatchford | 71,174 | 48.1 | |
| Peace and Freedom | Ben Dobbs | 1,685 | 1.1 | |
| Total votes | 147,929 | 100.0 | ||
| Turnout | ||||
| Democratic hold | ||||
1970
| Party | Candidate | Votes | % | |
|---|---|---|---|---|
| Democratic | Glenn M. Anderson (inc.) | 83,739 | 62.2 | |
| Republican | Vernon E. Brown | 47,778 | 35.5 | |
| American Independent | Robert W. Copeland | 1,724 | 1.3 | |
| Peace and Freedom | Thomas E. Mathews | 1,292 | 1.0 | |
| Total votes | 134,533 | 100.0 | ||
| Turnout | ||||
| Democratic hold | ||||
1972
| Party | Candidate | Votes | % | |
|---|---|---|---|---|
| Republican | Pete McCloskey (incumbent) | 110,098 | 60.2 | |
| Democratic | James Stewart | 72,759 | 39.8 | |
| Total votes | 182,857 | 100.0 | ||
| Turnout | ||||
| Republican hold | ||||
1974
| Party | Candidate | Votes | % | |||
|---|---|---|---|---|---|---|
| Democratic | John Hans Krebs | 66,082 | 51.9 | |||
| Republican | Bob Mathias (incumbent) | 61,242 | 48.1 | |||
| Total votes | 127,324 | 100.0 | ||||
| Turnout | ||||||
| Democratic gain from Republican | ||||||
1976
| Party | Candidate | Votes | % | |
|---|---|---|---|---|
| Democratic | John Hans Krebs (incumbent) | 103,898 | 65.7 | |
| Republican | Henry J. Andreas | 54,270 | 34.3 | |
| Total votes | 158,168 | 100.0 | ||
| Turnout | ||||
| Democratic hold | ||||
1978
| Party | Candidate | Votes | % | |||
|---|---|---|---|---|---|---|
| Republican | Charles (Chip) Pashayan | 81,296 | 54.5 | |||
| Democratic | John Hans Krebs (incumbent) | 67,885 | 45.5 | |||
| Total votes | 149,181 | 100.0 | ||||
| Turnout | ||||||
| Republican gain from Democratic | ||||||
1980
| Party | Candidate | Votes | % | |
|---|---|---|---|---|
| Republican | Charles (Chip) Pashayan (inc.) | 129,159 | 70.6 | |
| Democratic | Willard H. "Bill" Johnson | 53,780 | 29.4 | |
| Total votes | 182,939 | 100.0 | ||
| Turnout | ||||
| Republican hold | ||||
1982
| Party | Candidate | Votes | % | |
|---|---|---|---|---|
| Republican | Charles (Chip) Pashayan (inc.) | 80,271 | 54 | |
| Democratic | Gene Tackett | 68,364 | 46 | |
| Total votes | 148,635 | 100 | ||
| Turnout | ||||
| Republican hold | ||||
1984
| Party | Candidate | Votes | % | |
|---|---|---|---|---|
| Republican | Charles (Chip) Pashayan (inc.) | 128,802 | 72.5 | |
| Democratic | Simon Lakritz | 48,888 | 27.5 | |
| Total votes | 177,690 | 100.0 | ||
| Turnout | ||||
| Republican hold | ||||
1986
| Party | Candidate | Votes | % | |
|---|---|---|---|---|
| Republican | Charles (Chip) Pashayan (inc.) | 88,787 | 60.2 | |
| Democratic | John Hartnett | 58,682 | 39.8 | |
| Total votes | 147,469 | 100.0 | ||
| Turnout | ||||
| Republican hold | ||||
1988
| Party | Candidate | Votes | % | |
|---|---|---|---|---|
| Republican | Charles (Chip) Pashayan (inc.) | 129,568 | 71.5 | |
| Democratic | Vincent J. Lavery | 51,730 | 28.5 | |
| Total votes | 181,298 | 100.0 | ||
| Turnout | ||||
| Republican hold | ||||
1990
| Party | Candidate | Votes | % | |||
|---|---|---|---|---|---|---|
| Democratic | Cal Dooley | 82,611 | 54.5 | |||
| Republican | Charles (Chip) Pashayan (inc.) | 68,848 | 45.5 | |||
| Total votes | 151,459 | 100.0 | ||||
| Turnout | ||||||
| Democratic gain from Republican | ||||||
1992
| Party | Candidate | Votes | % | |
|---|---|---|---|---|
| Democratic | Leon Panetta (incumbent) | 151,565 | 72.1 | |
| Republican | Bill McCampbell | 49,947 | 23.7 | |
| Peace and Freedom | Maureen Smith | 4,804 | 2.3 | |
| Libertarian | John D. Wilkes | 4,051 | 1.9 | |
| Total votes | 210,447 | 100.0 | ||
| Turnout | ||||
| Democratic hold | ||||
1993 (Special)
| Party | Candidate | Votes | % | |
|---|---|---|---|---|
| Democratic | Sam Farr | 53,675 | 52.25 | |
| Republican | Bill McCampbell | 43,774 | 42.61 | |
| American Independent | Jerome N. McCready | 1,689 | 1.64 | |
| Green | Kevin Gary Clark | 1,226 | 1.19 | |
| Libertarian | Richard J. Quigley | 948 | 0.92 | |
| Independent | Peter James | 943 | 0.92 | |
| Independent | James Ogle | 444 | 0.43 | |
| No party | Tom Shannon (write-in) | 33 | 0.03 | |
| Total votes | 102,732 | 100.00 | ||
| Turnout | ||||
| Democratic hold | ||||
1994
| Party | Candidate | Votes | % | |
|---|---|---|---|---|
| Democratic | Sam Farr (incumbent) | 87,222 | 52.17 | |
| Republican | Bill McCampbell | 74,830 | 44.49 | |
| Green | E. Craig Coffin | 5,591 | 3.34 | |
| Total votes | 167,193 | 100.0 | ||
| Turnout | ||||
| Democratic hold | ||||
1996
| Party | Candidate | Votes | % | |
|---|---|---|---|---|
| Democratic | Sam Farr (incumbent) | 115,116 | 58.9 | |
| Republican | Jess Brown | 73,856 | 37.8 | |
| Natural Law | John Black | 6,573 | 3.3 | |
| Total votes | 195,545 | 100.0 | ||
| Turnout | ||||
| Democratic hold | ||||
1998
| Party | Candidate | Votes | % | |
|---|---|---|---|---|
| Democratic | Sam Farr (incumbent) | 103,719 | 64.55 | |
| Republican | Bill McCampbell | 52,470 | 32.65 | |
| Libertarian | Rick Garrett | 2,791 | 1.74 | |
| Natural Law | Scott R. Hartley | 1,710 | 1.06 | |
| Total votes | 160,690 | 100.0 | ||
| Turnout | ||||
| Democratic hold | ||||
2000
| Party | Candidate | Votes | % | |
|---|---|---|---|---|
| Democratic | Sam Farr (incumbent) | 143,219 | 68.7 | |
| Republican | Clint Engler | 51,557 | 24.7 | |
| Green | E. Craig Coffin | 8,215 | 4.0 | |
| Libertarian | Rick S. Garrett | 2,510 | 1.2 | |
| Reform | Larry Fenton | 2,263 | 1.0 | |
| Natural Law | Scott R. Hartley | 996 | 0.4 | |
| Total votes | 208,760 | 100.0 | ||
| Turnout | ||||
| Democratic hold | ||||
2002
| Party | Candidate | Votes | % | |
|---|---|---|---|---|
| Democratic | Sam Farr (incumbent) | 101,632 | 68.1 | |
| Republican | Clint Engler | 40,334 | 27.1 | |
| Green | Ray Glock-Grueneich | 4,885 | 3.2 | |
| Libertarian | Jascha Lee | 2,418 | 1.6 | |
| No party | Alan Shugart (write-in) | 27 | 0.0 | |
| Turnout | 149,296 | |||
| Democratic hold | ||||
2004
| Party | Candidate | Votes | % | |
|---|---|---|---|---|
| Democratic | Sam Farr (incumbent) | 148,958 | 66.8 | |
| Republican | Mark Risley | 65,117 | 29.2 | |
| Green | Ray Glock-Grueneich | 3,645 | 1.7 | |
| Peace and Freedom | Joe Williams | 2,823 | 1.2 | |
| Libertarian | Joel Smolen | 2,607 | 1.1 | |
| No party | David Mauricio Munoz (write-in) | 75 | 0.0 | |
| Turnout | 282,941 | |||
| Democratic hold | ||||
2006
| Party | Candidate | Votes | % | |
|---|---|---|---|---|
| Democratic | Sam Farr (incumbent) | 120,750 | 75.9 | |
| Republican | Anthony R. DeMaio | 35,932 | 22.5 | |
| No party | Jeff Edward Taylor (write-in) | 2,611 | 1.6 | |
| Total votes | 163,293 | 100.0 | ||
| Turnout | ||||
| Democratic hold | ||||
2008
| Party | Candidate | Votes | % | |
|---|---|---|---|---|
| Democratic | Sam Farr (incumbent) | 168,907 | 73.9 | |
| Republican | Jeff Taylor | 59,037 | 25.9 | |
| Independent | Peter Andresen (write-in) | 682 | 0.2 | |
| Total votes | 228,626 | 100.0 | ||
| Turnout | ||||
| Democratic hold | ||||
2010
| Party | Candidate | Votes | % | |
|---|---|---|---|---|
| Democratic | Sam Farr (incumbent) | 118,734 | 66.69 | |
| Republican | Jeff Taylor | 47,133 | 26.47 | |
| Libertarian | Mary V. Larkin | 8,753 | 4.92 | |
| Green | Eric Petersen | 3,429 | 1.93 | |
| Total votes | 178,049 | 100.00 | ||
| Turnout | ||||
| Democratic hold | ||||
2012
| Party | Candidate | Votes | % | |
|---|---|---|---|---|
| Democratic | Mike Honda (incumbent) | 159,392 | 73.5 | |
| Republican | Evelyn Li | 57,336 | 26.5 | |
| Total votes | 216,728 | 100.0 | ||
| Democratic hold | ||||
2014
| Party | Candidate | Votes | % | |
|---|---|---|---|---|
| Democratic | Mike Honda (incumbent) | 69,561 | 52% | |
| Democratic | Ro Khanna | 64,847 | 48% | |
| Total votes | 134,378 | 100.0% | ||
| Democratic hold | ||||
2016
| Party | Candidate | Votes | % | |
|---|---|---|---|---|
| Democratic | Ro Khanna | 142,268 | 61% | |
| Democratic | Mike Honda (incumbent) | 90,924 | 39% | |
| Total votes | 233,192 | 100.0% | ||
| Democratic hold | ||||
2018
| Party | Candidate | Votes | % | |
|---|---|---|---|---|
| Democratic | Ro Khanna | 159,105 | 75% | |
| Republican | Ron Cohen | 52,057 | 24% | |
| Total votes | 211,162 | 100.0% | ||
| Democratic hold | ||||
Historical district boundaries
References
- https://www.census.gov/mycd/?st=06&cd=17
- "Citizens Redistricting Commission Final Report, 2011" (PDF).
- "Partisan Voting Index – Districts of the 115th Congress" (PDF). The Cook Political Report. April 7, 2017. Retrieved April 7, 2017.
- https://elections.cdn.sos.ca.gov/sov/1994-general/ssov/governor-congress-district.pdf
- https://elections.cdn.sos.ca.gov/sov/1994-general/ssov/us-senate-congress-district.pdf
- https://elections.cdn.sos.ca.gov/sov/1996-general/ssov/president-congress-district.pdf
- https://web.archive.org/web/20110929224728/http://www.sos.ca.gov/elections/sov/1998-general/ssov/gov-cd.pdf#
- https://web.archive.org/web/20110929224732/http://www.sos.ca.gov/elections/sov/1998-general/ssov/sen-cd.pdf#
- "Statement of Vote (2000 President)" (PDF). Archived from the original (PDF) on May 20, 2011. Retrieved September 17, 2008.
- "Statement of Vote (2000 Senator)" (PDF). Archived from the original (PDF) on May 20, 2011. Retrieved September 17, 2008.
- Statement of Vote (2002 Governor) Archived November 11, 2010, at the Wayback Machine
- "Statement of Vote (2003 Recall Question)" (PDF). Archived from the original (PDF) on May 20, 2011. Retrieved October 8, 2007.
- "Statement of Vote (2003 Governor)" (PDF). Archived from the original (PDF) on May 20, 2011. Retrieved October 8, 2007.
- "Statement of Vote (2004 President)" (PDF). Archived from the original (PDF) on May 20, 2011. Retrieved August 8, 2007.
- Statement of Vote (2004 Senator) Archived August 10, 2011, at the Wayback Machine
- Statement of Vote (2006 Governor) Archived August 10, 2011, at the Wayback Machine
- Statement of Vote (2006 Senator) Archived August 10, 2011, at the Wayback Machine
- "(2008 President)". Archived from the original on February 11, 2009. Retrieved March 5, 2009.
- 1932 election results
- 1934 election results
- 1936 election results
- 1938 election results
- 1940 election results
- 1942 special election results
- 1942 election results
- 1944 election results
- 1946 election results
- 1948 election results
- 1950 election results
- 1952 election results
- 1954 election results
- 1956 election results
- 1958 election results
- 1960 election results
- 1962 election results
- 1964 election results
- 1966 election results
- 1968 election results
- 1970 election results
- 1972 election results
- 1974 election results
- 1976 election results
- 1978 election results
- 1980 election results
- 1982 election results
- 1984 election results
- 1986 election results
- 1988 election results
- 1990 election results
- 1992 election results
- 1993 special election results
- 1994 election results
- 1996 election results
- 1998 election results
- 2000 election results
- 2002 general election results Archived February 3, 2009, at the Wayback Machine
- 2004 general election results Archived August 21, 2008, at the Wayback Machine
- 2006 general election results Archived November 27, 2008, at the Wayback Machine
- Office of the California Secretary of State Archived December 21, 2008, at the Wayback Machine "United States Representative by District," (retrieved on August 8, 2009).
- Office of the California Secretary of State "United States Representative by District," (retrieved on March 24, 2011).
- 2012 general election results Archived October 19, 2013, at the Wayback Machine
- "U.S. House of Representatives District 17 - Districtwide Results". Archived from the original on December 21, 2014. Retrieved December 21, 2014.