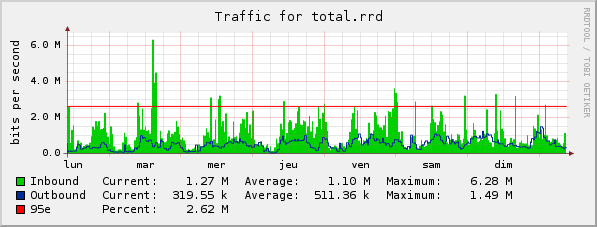
Burstable billing
Burstable billing is a method of measuring bandwidth based on peak use. It also allows usage to exceed a specified threshold for brief periods of time without the financial penalty of purchasing a higher committed information rate (CIR, or commitment) from an Internet service provider (ISP).
Most ISPs use a five-minute sampling and 95% usage when calculating usage.
95th percentile

The 95th percentile is a widely used mathematical calculation to evaluate the regular and sustained use of a network connection. The 95th percentile method more closely reflects the needed capacity of the link in question than tracking by other methods such as mean or maximum rate. The bytes that make up the packets themselves do not actually cost money, but the link and the infrastructure on either end of the link cost money to set up and support. This method of billing is commonly used in peering arrangements between corporate networks, it is not often used by ISPs because Internet service providers need committed information rates (CIRs) for planning purposes.
Since most networks are overprovisioned, there is often some room for some bursting without advanced planning (hence burstable billing). Ignoring the top 5% of the samples is a reasonable compromise in most cases (hence 95th percentile).
Many sites have the majority of their traffic on Mondays, so the Monday traffic determines the rate for the whole month. Some providers offer billing on the 90th percentile as an incentive to attract customers with irregular bandwidth patterns.[1]
The 95th percentile allows a customer to have a short (less than 36 hours, given a monthly billing period) burst in traffic without overage charges. The 95th percentile says that 95% of the time, the usage is at or below this amount. Conversely, 5% of the samples may be bursting above this rate.
The sampling interval, or how often samples (or data points) are taken, is an important factor in percentile calculation. A percentile is calculated on some set of data points. Every data point represents the average bandwidth used during the sampling interval (e.g., five minutes) and is calculated as the number of bits transferred throughout the interval divided by the duration of the interval (e.g., 300 seconds). The resulting value represents the average use rate for a single sampling interval and is expressed as bits per second (see data transfer rate).
Burstable rate calculation

Bandwidth is measured (or sampled) from the switch or router and recorded in a log file. In most cases, this is done every 5 minutes. At the end of the month, the samples are sorted from highest to lowest, and the top 5% (which equal to approximately 36 hours of a 30-day billing cycle) of data is thrown away. The next highest measurement becomes the billable use for the entire month.
Based on this model, the top 36 hours (top 5% of 720 hours) of peak traffic is not taken into account when billed for an entire month. Bandwidth could be used at a higher rate for up to 72 min a day with no financial penalty. Conversely, if peak traffic only appears for a brief instant and no additional traffic is generated the billing amount can be substantially higher than Average usage billing.
Special consideration
Inbound and outbound traffic is usually counted separately, as connections are full duplex allowing traffic in-bound and out-bound simultaneously. Some common algorithms are:
- Take the max(in, out) for each interval and use that as the source. This method is more complex to implement as it requires processing of each sample but results are closer to estimating total volume of data sent and received.
- Calculate the 95% value separately for in-bound data and out-bound data and then take the maximum of those two values. This method is simpler to implement but does not correctly estimate symmetric traffic patterns.
- Take the sum(in, out) for each interval. This method is simple to implement and does account for symmetric traffic patters; some ISPs use this method to approximate total volume of data sent and received.
Critics of the 95th percentile billing method usually advocate the use of a flat rate system or using the average throughput rather than the 95th percentile. Both those methods favour heavy users (who have interest in advocating for changes to billing method). Other critics call for billing per byte of data transferred, which is considered most accurate and fair.
See also
- MRTG - Used to review bandwidth usage and with patches, determine 95th percentile values.
- Cacti - another tool for 95th percentile values also based on RRDtool
- LibreNMS - Opensource GPLv3 license which provides 95th percentile based billing.
- Observium - Opensource (QPL) software providing both per-port 95th percentile calculation and multi-port billing tool supporting 95th percentile calculation.
References
- Goldman, Alex. "Cogent's Latest Price Drop" Archived July 20, 2008, at the Wayback Machine, ISP PLANET, April 3, 2006. Accessed April 24, 2008.
External links
- PRTG Network Monitor - Many sensors to monitoring all aspects of networks, server (net, disks, memory, process, services...), applications and business. Including reports with 95th calculation.
- MRTG Help Site - Helpful page with example MRTG graphs and explanations.
- Torrus reporting setup guide - Implementation details and installation guide for monthly reports of traffic usage and 95th Percentile in Torrus
- Real Traffic Grabber - RTG gets SNMP statistics and does monitoring. It is an open source and includes graphics and a report generator.
- Ocoloc - Free / open source basic SNMP collection and reporting tool for 95th percentile calculations