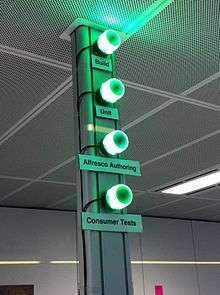
Build light indicator
A build light indicator is a simple visual indicator used in Agile software development to inform a team of software developers about the current status of their project. The actual object used can vary from a pressure gauge to a lava lamp, but its purpose remains the same: to quickly communicate whether a software process (such as a 'build') is successful or not.

History
The build light indicator originated from CruiseControl, a continuous integration tool created by employees of ThoughtWorks. Though it primarily functioned as a web page dashboard that could report more detailed information about a build, the software could also be integrated into external devices for simpler reporting.[1]
Use
The traditional use of a build light is to determine the success of a software build in a continuous integration (CI) system.[2] Different development teams have used different indicators, but a popular choice is the green and red lava lamp – green when the build is successful and red when something is wrong.[3] Build lights may even be remotely accessible through a webcam or other means.[4] However, since many of the tests in busy development offices will always be in a state of re-test after the latest changes, some indicators have a three state display[2] – pass, fail and being re-tested, to provide a more nuanced indicator for staff and managers.[5]
Beyond single indicators
With the growth from continuous integration to continuous testing, the number of simultaneous build targets may increase, even for a single codebase. As well as a simple build (i.e. compilation) target, there will now be unit testing and various levels of system testing. As extensive tests are slow and it is desirable to keep fast tests running on a fast cycle to give rapid feedback to the developers, the number of build targets may increase to fifty or more. This is too many to show with a simple lava lamp display. Integration servers like Jenkins offer a web-accessible dashboard page and this may be permanently displayed on a wall-mounted flat screen monitor instead. The details of such a dashboard are too small to read across an office, but the colour changes present an overall picture of status.
With a methodology of continuous test-driven development, new tests are released before working code is developed to pass them. There is thus a period when some tests are known, and indeed required to be failing.[6] Failing tests are needed as they demonstrate the capability of the new tests to detect the situation of concern. Once the new code is developed and working, these tests begin to pass. A continuous testing environment into which new tests are released before their code thus requires two build targets: one tracks the latest code and tests, the other 'release candidate' is only updated in increments when all tests are fulfilled by passing code. For the build indicator this also implies that one of those targets will frequently be shown as "failing" its tests. As this anticipated "failure" would be misleading to naive watchers, the build indicator should either hide it or present it distinctly.
Where several code targets, such as old product versions, are still supported for CI, but are not under such active development, then a complete dashboard may become dominated by "stale" targets that rarely change. In this case a selected dashboard may be more appropriate, where only those targets that are either failing, or are recently active, are displayed. The full dashboard is available to developer's desktops, but the wall display shows only the significant highlights. Such dashboards are often coded locally by screen-scraping the main dashboard and applying relevant local filters to it, according to local needs. One drawback to a dynamic filtered dashboard, compared to a static dashboard, is that the position of icons for a particular target may shift on the screen, making it hard to read from across an office. In this case, distinctive icons, such as a product logo, may be displayed rather than simple colour blocks.
References
| Wikimedia Commons has media related to Build light indicators. |
- Mike Cohn (10 July 2009). Succeeding with Agile: Software Development Using Scrum. Pearson Education. pp. 245–. ISBN 978-0-321-57936-2. Retrieved 23 August 2011.
- "The Orb - Build Indicator Lamp". agileskunkworks.org. Archived from the original on June 11, 2010.
- Ken W. Collier (27 July 2011). Agile Analytics: A Value-Driven Approach to Business Intelligence and Data Warehousing. Addison-Wesley. pp. 281–. ISBN 978-0-321-50481-4. Retrieved 23 August 2011.
- Karsten, Paul; Cannizzo, Fabrizzio (2007). "The creation of a distributed agile team". XP'07 Proceedings of the 8th International Conference on Agile Processes in Software Engineering and Extreme Programming. Lecture Notes in Computer Science. Association for Computing Machinery. 4536: 235–239. doi:10.1007/978-3-540-73101-6_44. ISBN 978-3-540-73100-9.
- Build Light – Continuous Delivery meets Reengineering an[sic USB driver] Archived September 15, 2013, at the Wayback Machine - Bernd Zuther, comSysto GmbH, 2013
- Madeyski, L.; Kawalerowicz, M. (4–6 July 2013). Continuous Test-Driven Development - A Novel Agile Software Development Practice and Supporting Tool. Proc. 8th International Conference on Evaluation of Novel Approaches to Software Engineering (ENASE). Angers, France. p. 262.