Why is my computer slow despite low percentage of CPU and memory being used?

1

1

My computer has recently been lagging in an annoying way despite its low usage of resources. It takes on average 5 seconds for an application to open after clicking it. Physical specification is as follows (figure below): enter image description here
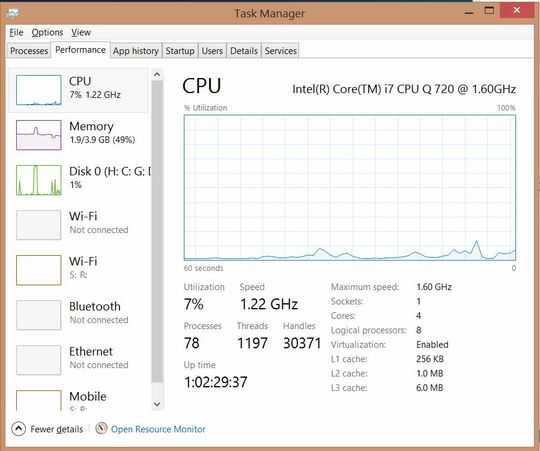
In order to check for disk errors, I ran the CHKDSK utility with the result in this link (as seen in the output, no bad sectors are found):

So what is the problem really?
(Note: I am using Windows 8.1)
(Note 2: When lagging occurs, the application I am working in such as Word is doing well, i.e. responsive to my typing and editing, but when I want to switch apps, the disaster occurs and I have to wait at least 5 seconds for the computer to respond. Also, in this case, my clicking on anything be it Task Bar or desktop, etc., is like clicking (either right or left click) on dead things., and still task manager shows little resources being used.)
(Note 3: Typically, system lag occurs 1-2 hours after system start-up. Before that, everything is normal. I am using a cool pad and when I touch the system fan output I don't find it too hot, so I don't think it is overheating or something that causes the lagging).

codezombie

Posted 2015-09-20T16:19:16.593

Reputation: 1 426

2

The fact that its tabbing between programs that triggers it hints to me that its paging related, you wake the process and it trys to pull everything back into memory. A slow/troublesome disk could make this take forever. Try running diskmark while you're at it: http://crystalmark.info/software/CrystalDiskMark/index-e.html

– Linef4ult – 2015-09-20T18:31:11.823

Answers

2

This could still be a disk issue. You might want to download Data Lifeguard Diagnostic for Windows from Western Digital and run the long test. It should work on any brand SATA hard drive but can give false info for SSDs.

Another common performance issue is antivirus protection (AV). Make sure you don't have more than one real-time AV running. If you know your product key then try uninstalling your AV, reboot, retest performance, reinstall an AV.

After that you can download process monitor and look at what is actually happening when you open a program. This can be a tedious process but if it's a software/OS issue this should help you find the problem. You can right click a process name and choose exclude to reduce the amount of information you see in Process Monitor. After a little use you can get the hang of creating custom filters too. Probably the most important thing is to select File and then uncheck "capture events" to stop the capture once you have captured enough data to start your search. Also, don't get hung up on errors. There will always be some "no such file", "name not found", "access denied" and even some "Buffer Overflow" messages. That is normal.

CMOSbattery

Posted 2015-09-20T16:19:16.593

Reputation: 36

As a matter of fact, I don't use any antivirus application, except Windows 8.1's own Defender and Firewall. – codezombie – 2015-09-20T23:21:29.317

1

The event viewer might be also a worth a look. Especially going to Custom Views -> Administrative Events.

Maybe some application crashes in background all the time and gets restarted.

And don't give too much on the taskmgrs monitoring. I haven't found it really reliable, but that's just more sth. of my opinion ;-)

larkey

Posted 2015-09-20T16:19:16.593

Reputation: 1 590

I'll check it out for sure, but what is PLF if you don't mind? Seeing the rifle in penguin's arms, I feared it might related to IS or something, lol! – codezombie – 2015-09-20T22:31:55.977

1@JasonStack Nah, "Penguin Liberation Front". It's just about Linuxers (Linux>Tux>Penguin) "fighting" for free software (free as in speech, not in beer) - I'm peaceful though :P (afaik the rest of them too) – larkey – 2015-09-20T22:33:45.540

1

I found this when I checked the Administrative logs: lots of recent red errors and several yellow warnings. As seen in the capture, yellow errors say something like The IO operation at logical block address 09 for Disk 0 (PDO name: \Device\00000044) was retried.

– codezombie – 2015-09-20T22:48:40.450

@JasonStack Definitely supporting the disk-theory already mentioned here. I'm wondering why it does write so much (maybe it's related to the SharedAccess_NAT messages? Maybe get some detail on those). A bit of an explanation on the IO Operarions being retried: http://serverfault.com/questions/499269/what-does-the-io-operation-at-logical-block-address-for-disk-was-retried -- basically it's usually a disk that has problems to keep up.

– larkey – 2015-09-20T23:01:05.023

In fact, the SharedAccess_NAT's general definition says: The ICS_IPV6 failed to configure IPv6 stack, which I assumed to do nothing with disk, rather dealing with network due to IPV6 mentioned in it. So, you think this might be a sign of my hard disk dying? – codezombie – 2015-09-20T23:07:25.637

1@JasonStack This is weird. Are the error messages consistent across those SharedAccess_NATs messages (and not only grouped)? If there are different things that fail it might hint back to the disk - if it's just IPv6, this seems to be unrelated. Anyway, you could - for testing purposes - deactivate IPv6 in the adapter settings, reboot. Just making sure it isn't related. -- On the disk side of things: Dieing - maybe. Difficult to say. But it seems to be too slow at least - maybe just faulty parts so it needs to retry writing somewhere else. – larkey – 2015-09-20T23:15:48.350

1@JasonStack To narrow things down a bit try this: - Open all applications | Then, maybe every full minute switch between apps, monitor if it lags, take a note | After 5 times or so, go to the eventviewer and observe the events around the full minutes. – larkey – 2015-09-20T23:17:28.103

Another recent warning logged in Eventviewer is The shadow copies of volume C: were aborted because of an IO failure on volume C:. source: volsnap. – codezombie – 2015-09-21T12:39:02.787

Let us continue this discussion in chat.

– codezombie – 2015-09-21T12:39:46.270