7
1
Before I say anything at all, I want you all to know where I've been with this issue:
- I have run multiple AV scans, including: Malwarebytes, Sophos Virus Removal, ADWCleaner, ESET Smart Security 4 & Hitman Pro which did find some PUPs and remove them.
- I have RAMMap, Windows WDK with Poolmon & Process Explorer installed.
- I have updated all drivers, disabled all useless (aka unused/not needed) processes and services and restarted my computer multiple times over the course of yesterday and today (when the issue began).
- Please, when I talk about this issue, don't tell me that unused RAM is wasted RAM as a valid answer to my issue. The issue is not that simple. When my RAM fills up, I experience performance issues and slowdowns of my system that I was not experiencing before, including the RAM being maxed out and system stuttering/performance issues when it is maxed out, forcing me to restart my computer.
Here are my System Specs:
Operating System: MS Windows 7 Ultimate 64-bit SP1
CPU: Intel Core i7 960 @ 3.20GHz 48 °C Bloomfield 45nm Technology
RAM: 6.0GB Triple-Channel DDR3 @ 534MHz (8-8-8-20)
Motherboard: ASUSTeK Computer INC. SABERTOOTH X58 (LGA1366) 35 °C
Graphics: NVIDIA GeForce GTX 670
Hard Drives: 2930GB Seagate ST3000DM001-1CH166 ATA Device (SATA) 30 °C
Audio: Realtek High Definition Audio (From Motherboard)
What I have found out using poolmon is that I have a driver or something else that is not releasing frees and is steadily increasing named "Proc".
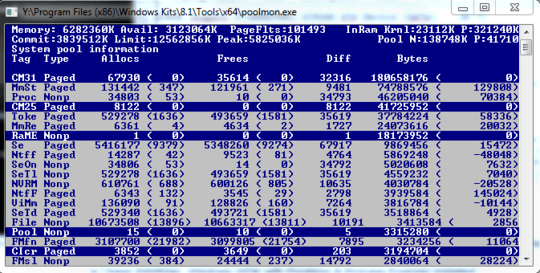
As you can see, Proc has a whopping 10 frees and 46205040 bytes being used. And that number is always climbing.
What I have found from pooltag.txt (if anyone is reading this and is interested as to where to find this file, you can look here: Y:\Program Files (x86)\Windows Kits\8.1\Debuggers\x64\triage), is this description: "Proc - nt!ps - Process objects", which is pretty uninformative given the generic description. Either way, this issue seems to compound when I run a highly intensive process (such as World of Warcraft which normally takes up 1.6GB of RAM).
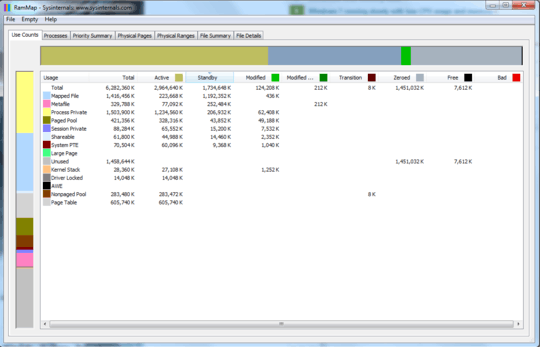
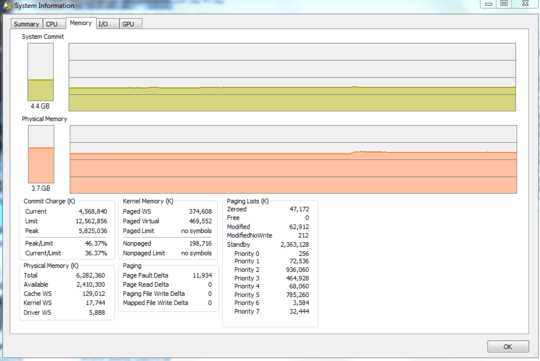
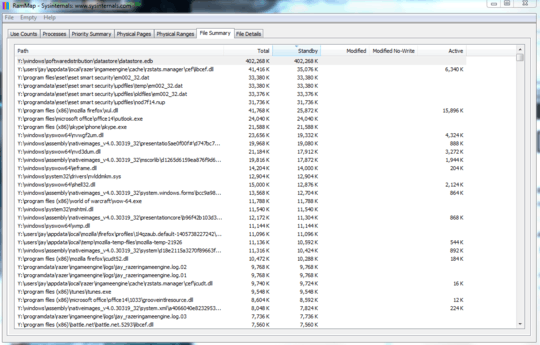
When that process is ended, RAM usage remain as if the program never closed. When I look at RAM map, sometimes over 1.5GB is remaining in standby. Even when I clear it in RAMMap, it does not clear it and that ram is not freed up to be reused.
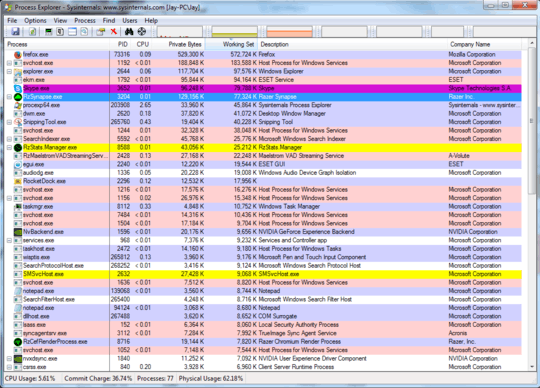
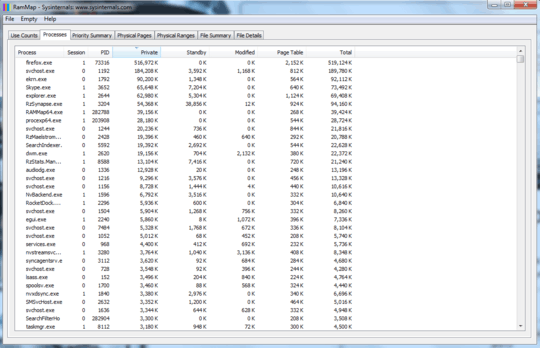
As you can see here, I have 2.9GB used (due to Firefox, Skype and a few other programs), but I have over 1.5GB in standby that is unused, and TaskManager & Process Explorer report that I'm using closer to 4GB.
One more issue that I've been noticing: I had updated my Ethernet Drivers due to some lag issues I was experiencing with my internet (had a modem replaced and then updated them). The problem went away. I left for Thanksgiving for about a week, at which time my computer was off. When I returned home, I noticed that process: "svchost -k LocalSystemNetworkRestricted", "svchost -k netsvcs" would at times be using over 500-700MBs of RAM, which I had never seen before. Right now it is sitting around 164MB, but I had not even seen it come up near that number before I left.
I looked over all the programs, uninstalled a few that I had installed before I left, then did virus scans which removed some more stuff, and even rolled back my Ethernet driver. The only updates I had for Windows 7 were for Windows Defender (which I have subsequently disabled). Yet this strange behavior remains.
In a nutshell:
- Driver or System Resource "Proc" (full description: "Proc - nt!ps - Process objects") as shown in PoolMon.exe is steadily climbing in bytes used but is not freeing them, eventually maxing RAM and causing system instability and stutters
- "svchost -k LocalSystemNetworkRestricted" & "svchost -k netsvcs" processes have increased usage in RAM, despite anything hardly changing in the system.
Please let me know if anyone can help me.

SuperJ
Posted 2014-12-01T07:58:42.117
Reputation: 101

2Will do. Not sure why this has been downvoted. – SuperJ – 2014-12-01T08:33:38.823
1@SuperJ Because of the misinformation you included in the question. Unused RAM is always wasted RAM. It cannot be saved for later. This is just a fact and saying it's "not true in this case" is nonsense. (I'm not sure why you thought that would help to troubleshoot what is likely a driver leak.) – David Schwartz – 2014-12-01T08:34:23.203
Or someone else could give SuperJ an upvote to reach 10 rep. :) – Peter – 2014-12-01T08:35:01.963
I think missunderstanding like this is not a reason for downvoting. – Kamil – 2014-12-01T08:35:21.707
1Then explain to me why my system halts when it hits 6.0 GB used when it only adds up to 2GB of ram used by my programs in Taskmanager and Process Explorer? The reason I say that is people shrug off this issue with that stupid answer, and its just not true because my ram is being USED, its just not being Freed afterward. – SuperJ – 2014-12-01T08:35:42.887
How do you know that 6GB is used if Task Manager shows 2GB usage? Or maybe you mean 2GB usage in your user processes? Have you tried "Show processes from all users" button? – Kamil – 2014-12-01T08:36:37.480
Kamil, meant that it only adds up to 2GB, not shows. My bad. – SuperJ – 2014-12-01T08:38:58.217
I did a stringsearch for Proc and it came up with over 100 different drivers. Heres just a taste. This is going to be hard:
Y:\Windows\System32\drivers>findstr /m /l Proc *.sys 1394bus.sys 1394ohci.sys acpi.sys adp94xx.sys adpahci.sys afcdp.sys afd.sys agilevpn.sys amdk8.sys amdppm.sys amdxata.sys appid.sys arc.sys arcsas.sys asyncmac.sys ataport.sys b57nd60a.sys blbdrive.sys bowser.sys BrFiltLo.sys bridge.sys BrSerId.sys bxvbda.sys cdfs.sys Classpnp.sys cng.sys crashdmp.sys csc.sys dfsc.sys dtsoftbus01.sys Dumpata.sys dxapi.sys dxg.sys dxgkrnl.sys dxgmms1.sys eamonm.sys ehdrv.sys – SuperJ – 2014-12-01T08:57:15.193
Please post the contents of the process and files tabs of RAMMap – DavidPostill – 2014-12-01T09:01:46.537