10
8
I've got a Windows 7 machine that keeps running low in RAM. I can see the free RAM going down over a few hours until the point the machine becomes unresponsive. I've checked the process list and none of them takes that much RAM.
I've also checked the number of handles per process and various other indicators but still can't find why the machine runs out of RAM.
Is there any good way to check how the memory is used in Windows?
Edit
Here is the result of tasklist a few minutes before the machine becomes unresponsive:
Image Name                     PID Session Name        Session#    Mem Usage
========================= ======== ================ =========== ============
System Idle Process              0 Services                   0         24 K
System                           4 Services                   0        300 K
smss.exe                       196 Services                   0      1,024 K
csrss.exe                      272 Services                   0      4,336 K
wininit.exe                    320 Services                   0      4,184 K
csrss.exe                      332 Console                    1      3,516 K
winlogon.exe                   372 Console                    1      6,316 K
services.exe                   416 Services                   0      8,112 K
lsass.exe                      432 Services                   0     10,088 K
lsm.exe                        440 Services                   0      3,664 K
svchost.exe                    548 Services                   0      8,152 K
svchost.exe                    620 Services                   0      6,564 K
svchost.exe                    660 Services                   0     15,764 K
LogonUI.exe                    724 Console                    1     18,428 K
svchost.exe                    768 Services                   0      7,992 K
svchost.exe                    828 Services                   0      9,724 K
svchost.exe                    852 Services                   0     28,092 K
svchost.exe                    176 Services                   0     13,096 K
spoolsv.exe                    824 Services                   0     10,608 K
svchost.exe                    952 Services                   0     11,632 K
svchost.exe                   1076 Services                   0      8,524 K
fshoster32.exe                1120 Services                   0      9,148 K
fsorsp.exe                    1200 Services                   0      8,036 K
fsgk32.exe                    1324 Services                   0      3,084 K
cygrunsrv.exe                 1552 Services                   0      5,852 K
conhost.exe                   1864 Services                   0      2,996 K
sshd.exe                      1896 Services                   0      7,804 K
FSMA32.EXE                    2024 Services                   0      1,628 K
svchost.exe                   1320 Services                   0      5,092 K
fssm32.exe                    1704 Services                   0      2,196 K
FSHDLL64.EXE                  2120 Services                   0        644 K
SearchIndexer.exe             3260 Services                   0     13,596 K
sshd.exe                    138920 Services                   0      8,696 K
sshd.exe                    138448 Services                   0      8,696 K
sshd.exe                    138660 Services                   0      8,696 K
bash.exe                    137924 Services                   0      5,380 K
bash.exe                    137820 Services                   0      3,832 K
SAV32CLI.EXE                136344 Services                   0    133,868 K
WmiPrvSE.exe                139444 Services                   0      7,168 K
sshd.exe                    139672 Services                   0      8,692 K
sshd.exe                    139876 Services                   0      8,684 K
bash.exe                    139992 Services                   0      5,432 K
bash.exe                    140040 Services                   0      3,996 K
bash.exe                    140200 Services                   0      5,400 K
bash.exe                    139424 Services                   0      4,048 K
typeperf.exe                139300 Services                   0      5,372 K
sleep.exe                   138268 Services                   0      2,272 K
sshd.exe                    139612 Services                   0      7,168 K
sshd.exe                    137720 Services                   0      5,700 K
bash.exe                    139524 Services                   0      5,304 K
bash.exe                    138952 Services                   0      3,756 K
tasklist.exe                137580 Services                   0      5,164 K
bash.exe                    139460 Services                   0      5,452 K
bash.exe                    139796 Services                   0        104 K
At that point, wmic OS get FreePhysicalMemory /Value reports about 400 MB of free memory out of 2GB.
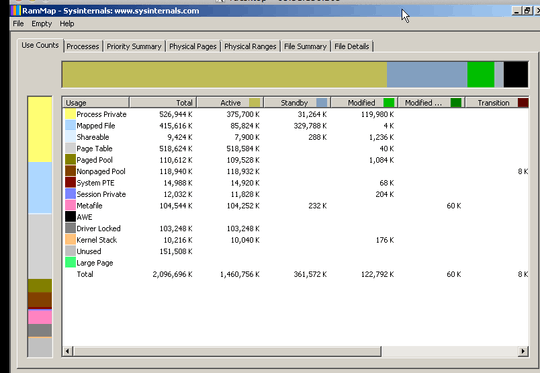
RamMap:
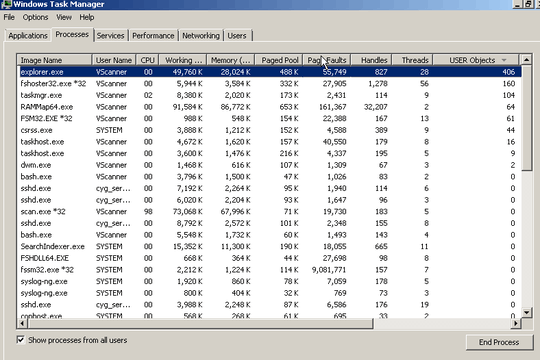
Task Manager:

laurent
Posted 2014-06-04T18:30:11.283
Reputation: 5 258


1Can you restart your computer and post a screenshot of your Task Manager processes? And make sure to display processes from all users please. If you have more than 50-60 after a reboot then there are definitely things you can do but if nothing looks fishy then things could get tricky.. – MonkeyZeus – 2014-06-04T18:41:27.220
1Are you running out of virtual memory or physical memory. The solution and cause are different. A low virtual memory warning is a configuration problem, being low on physical memory, means you have to many processes running. – Ramhound – 2014-06-04T18:41:44.707
1Do you have any evidence that the cause is a memory leak? It sounds like you have good evidence that it's not a memory leak. (Though it could be a busted driver, I guess.) – David Schwartz – 2014-06-04T19:01:56.553
Thanks for the feedback. I've added some more info to the post, in particular the task list. It is the free physical memory that keeps going down over time. Is it possible to check how it is used? – laurent – 2014-06-04T19:15:42.370
It seemed that sshd.exe and bash.exe were spawned multiple times. Do you run server apps on that machine? If you're interested in what spawned them, you may use Process Explorer to check process trees.
– Scott Rhee – 2014-06-05T01:55:44.7331
post screenshots of RAMMAp: http://technet.microsoft.com/en-us/sysinternals/ff700229.aspx
– magicandre1981 – 2014-06-05T04:07:46.350@ScottRhee, yes it's a vm that's being accessed via SSH. Then I guess there must be one instance of bash.exe per sshd.exe. – laurent – 2014-06-05T15:55:31.320
@magicandre1981, I have added a screenshot of RamMap. – laurent – 2014-06-05T16:27:29.713
To rule out bad drivers, have a look at Paged and Nonpaged Pool Sizes (for example in Process Explorer) - if they get too high, check PoolMon (but you'll probably need to debug your vm with a kernel debugger to get more details) – mihi – 2014-06-05T16:51:33.903
I'd set up a few perfmon performance counters (length of processor queue, disk activity percentage, swap disk activity percentage, page faults, resident ram, virtual ram size, to name a few) and have a look how they change over time if you can see any discrepancies in these values - if you know what exactly goes up/down, monitor it in more detail. – mihi – 2014-06-05T16:53:49.047
@mihi, thanks I'm going to try this. I've also added a screenshot of task manager some time before the crash. In particular, I see there's a process with 9 millions page faults though I don't know if this is relevant. – laurent – 2014-06-05T17:52:52.697
As page faults is an accumulating counter, it does not tell much if you don't know how long the process has been running. (Page Fault Delta is better to see a current snapshot of what is swapping, and correlating page faults to uptime if you want to know if the machine has been out of RAM earlier) – mihi – 2014-06-06T17:12:42.407
for me the rammap-screenshot looks quite good. 400+ mb of cached files, no leaks nowhere to see. @this.lau_: check out http://channel9.msdn.com/Events/TechEd/NorthAmerica/2011/WCL405
– akira – 2014-06-06T17:44:57.793@akira the usage is bad. The page table entry is too high. I posted how to trace this. – magicandre1981 – 2014-06-15T08:47:52.793
@magicandre1981: "too high" implies you know proper values. what are they? – akira – 2014-06-15T08:59:17.347
@akira look at my values. Everything over 100MB is too much. – magicandre1981 – 2014-06-15T18:00:44.540
@magicandre1981: because of … ? you are not explaining where the "100mb" value comes from. – akira – 2014-06-15T18:42:23.937