1
The Task
I'm putting together a dashboard wherein I'm building several charts. I've attempted to use a pivot chart (2D line chart) to pull data from two different pivots (with the same source data). However, that didn't work. So I've begun to try to achieve the same goal using a regular line chart.
The Issue
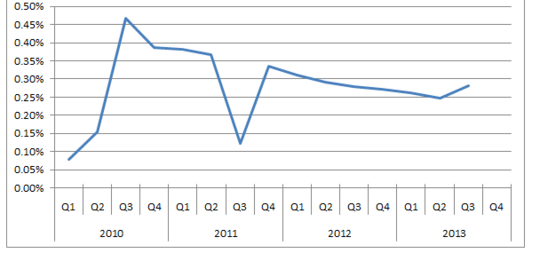
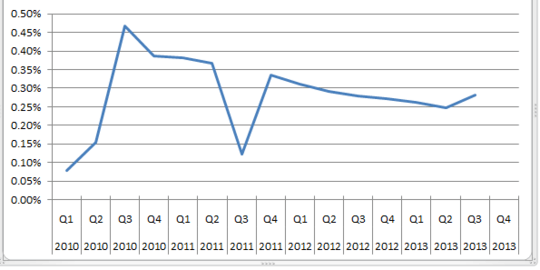
See the below picture for what I'm trying to accomplish:
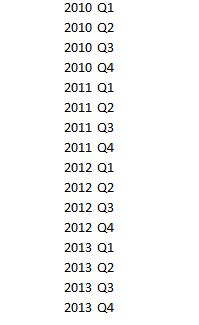
Notice the quarters are grouped by year. This is how the pivot chart grouped the categories.
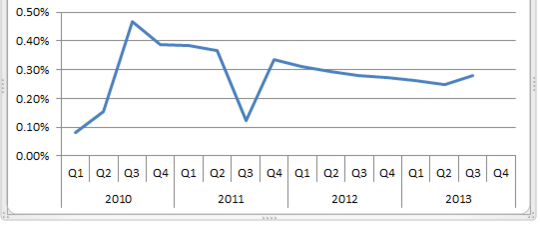
Now see below for what I'm able to accomplish with a regular line chart:
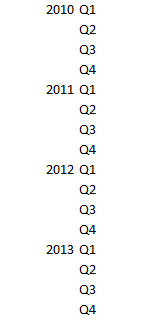
Notice how the years won't group together. I've tried messing with the category settings, but to no avail.
Is there something easy I'm missing here? Shouldn't I be able to mimic a pivot chart with a regular one? Any advice will be appreciated.

ARich
Posted 2013-11-07T00:40:02.843
Reputation: 172