How to tell which process is hogging my CPU when they don't add up to 100%?

9

1

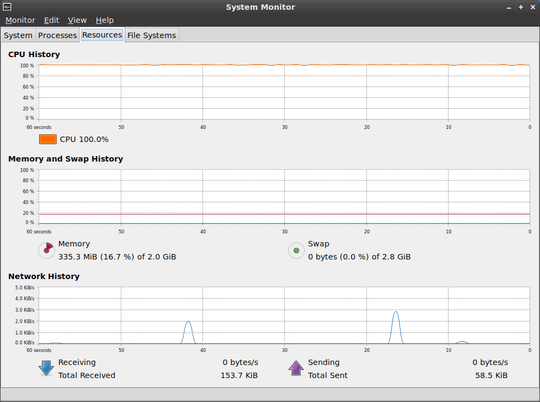
Ubuntu's System Monitor applet shows 100% CPU usage continuously. If I click it, the resources tab shows it at 100% continuously, too. If I go to processes, though, to find out which process is the culprit, there is nothing above 10%. If I run top there is nothing above 10%. The individual processes do not add up to 100%. I try killing lots of processes, but the overall usage continues to be 100%. How can I find out what's hogging the CPU?

alt text

This is an unusual situation on a computer I use daily, which is never anywhere near 100% CPU unless I'm doing something that requires it (like loading 32 Firefox tabs), after which it goes back to a normal idle level. It's not a new install or anything. There is no reason the processor should be maxed out. I'm not sure when it started or if I changed something that caused it to happen.

Normally I would use top or System Monitor and find the process that had gone out of control, but I can't find anything with those tools this time. It persists after reboots and everything.

And the processor is obviously hot, so it's not an erroneous reading.

Update: I tried killing every process, one at a time, until the problem went away, and killing vino-server finally fixed it, even though that process never went above 5%. I had enabled Remote Desktop a few days ago (and have obviously now disabled it).

But the question remains: How did a single process manage to use 100% CPU while top only showed that process at 5%? How do I identify culprits like this in the future?

Looks like I'm not the only one who's had this problem:

Still a problem in both jaunty & karmic. Interestingly, both System Monitor & htop do not show the sum of individual processes being anywhere near 100% cpu.
endolith

Posted 2009-11-04T12:44:38.507

Reputation: 6 626

2Is your system also slow? Might be a false reading. – Bobby – 2009-11-04T13:16:32.723

Answers

9

When you say "nothing above 10%" do you mean "no one thing above 10%"? It only takes 11 things at ~9% to hit 100% in total.

Also, some of the measured used CPU time could be I/O wait time - time in which a process could be doing something but isn't because it is waiting for an I/O device to respond (i.e. it has made a disk request and the disk has not yet found the right bit of data and returned it). In top, this can be seen on the CPU line(s) as the %wa measure. The I/O wait state is a little odd - the CPU isn't actually busy doing anything (so if another process wanted to do some computation it would be able to) but it does count towards the system load figures as system load represenets more than just the CPU activiy.

It would be helpful to add the output of top -n 1 to your question.

Also, if your kernel is recent enough to have the IO accounting feature (if you are using a recent release of Ubuntu it should be) and it is turned on, you can see what processes are actively performing I/O operations by running iotop -n 1 -ob (iotop might not be installed by default, if you don't have it try install with apt-get install iotop or by finding it in the GUI package manager.

David Spillett

Posted 2009-11-04T12:44:38.507

Reputation: 22 424

1+1 for asking to add top -n 1 to the question – Tarnay Kálmán – 2009-11-04T14:53:18.010

2

I had a similar problem. The processor was chugging along on full, and none of the processes in System Monitor showed anything. I found one answer by using the "top" command in a terminal window. It showed that apt was hogging my cpu for no good reason. So why didn't System Manager show this? Turns out there's an option under View for All Processes; mine was checked as My Processes, so I never saw the culprit. Hope this helps.

Ike Hall

Posted 2009-11-04T12:44:38.507

Reputation: 21

0

I have the same problem, but found out that Xorg was using 50% of the CPU while this showed out that it [this bug] could be fixed with the command sudo rmmod ums_realtek. This time Xorg only used about 5-10% CPU in the system monitor, but in the resources tab it still showed 100%.

While I was monitoring the system monitor, I saw a blink of a root proses using 100% CPU! I didn't have time to see what it was, but I am sure this has something to do with it.

NatureShade

Posted 2009-11-04T12:44:38.507

Reputation: 101

-1

  1. apt-get install cpufrequtils
  2. open /etc/rc.conf
  3. add the following to the MODULES: MODULES=( #your-modules-don't-touch# acpi-cpufreq cpufreq_ondemand cpufreq_performance)
  4. Reboot

After rebooting, you should run cat /sys/devices/system/cpu/cpu0/cpufreq/scaling_available_governors to see which modules are loaded.

During the work, you may change the governors to whatever fits your needs. For example:

  • cpufreq-set -r -g ondemand

You can use one of the following governors:

  • performance: it runs the CPU at max clock (module: cpufreq_performance)
  • ondemand: dynamically switches between the CPU(s) available clock speeds based on sys load (module: cpufreq_ondemand)
  • conservative: Similar to ondemand, but CPU(s) clock speed switches gradually through all available frequencies (based on sys load) (module: cpufreq_conservative)
  • powersave: CPU(s) runs at minimum speed (module: cpufreq_powersave)
  • userspace: allows the user to manually set CPU clock speed. (module: cpufreq_userspace)

If you're using GNOME2, there's a applet, which is amazing.

  1. Right-click on your panel
  2. Add applet
  3. start typing: CPU, you should be able to see it :)
  4. Click Add

By using this applet, you can switch between available governors (you added them into /etc/rc.conf before).

For example, I am using ondemand all the time, because I don't need full-performance to run eclipse and Android emulator on my ArchLinux :P

Summa Summarum - google for cpufrequtils and learn how to use it :) That pckg saved my time and money ;D

Cheers!

Nikola

Posted 2009-11-04T12:44:38.507

Reputation: 130

-1

The first question is whether your system seems slow or unresponsive. It's your CPU, after all, you paid for it, and you have the right to run it full bore for your purposes. The second question is whether you're just trying to do too much with your system, and should consider upgrading if possible. My first Linux box had a slow 486 in it, and it was real easy to top it out. If you're running on an OLPC XO, for example, your resources are real limited.

Seriously, you're unlikely to be running numerous excessive resource hogs simultaneously. If no process is taking over 10%, then your system is being nibbled to death by ducks, and you're not going to be able to reduce the load without reducing what you're doing.

That being said, check out your system services, and turn off any of them you don't want. Consider uninstalling the ones you're really sure you don't want (sudo apt-get remove foo). Particularly if you're overloading the system, any reduction in load can only help. Try to quit out of programs you're not using.

If there is one process that's using all available CPU, try finding it by running top and noting about what % of resources the major processes are using. When you kill a few, see if one rises more rapidly than the others. Of course, killing such a process won't buy you all that much, since it's no more than 10% of the load.

David Thornley

Posted 2009-11-04T12:44:38.507

Reputation: 701

If I were using the CPU, I would know it. It doesn't run at 100% continuously during normal operation, and it certainly shouldn't when I've closed everything I can think of that might be using it. – endolith – 2009-11-04T20:18:46.777