How do I use gnuplot to create a 3d phase-space plot?

3

1

Have a look at this webpage - enclosed but not encrypted

For a three-dimensional phase-space plot, the sequence a, b, c, d, e, f, etc. can be used as space coordinates (a-b, b-c, c-d), (b-c, c-d, d-e), (c-d, d-e, e-f), etc. Patterns in the plot created reveal recurring relations between subsequent sequences. In this phase plot, 50,000 16-bit random numbers would produce an unstructured cloud of dots.

I want to do exactly the same kind of thing. I have a binary file (about 10 MB) and I'd like to create some nice gnuplot style graphs like they have on that web page.

What do I type into gnuplot to make that happen?
jecniencikn

Posted 2013-07-26T16:29:05.060

Reputation: 31

What is the data in that file you want to display? The individual bytes? – Jan Doggen – 2013-07-26T17:41:29.450

@JanDoggen - yes please. I want to recreate the plots as shown in the given website, but using my own data. I want to use their gnuplots as a test of some data that I have. – jecniencikn – 2013-07-26T21:02:07.000

Answers

1

  1. Create a dump of your binary file in a format suitable for gnuplot. For convenience I used hexdump with a custom output format, which we need to store in a file, e.g. as gnuplot.hdp (in principle the format string can get passed via a command line option, but then we will run into too much nested quotes in the gnuplot script):

    $ cat gnuplot.hdp
    3/1 "%03d " "\n"
    
    $ hexdump -f gnuplot.hdp random.data | head -n 4
    236 027 076
    070 243 055
    047 115 211
    184 206 073
    
  2. Plot the data with gnuplot. In the simplest case, we plot bytes 1, 2, 3 and 4, 5, 6 etc. as x, y, z coordinates:

    set parametric
    unset border
    unset xtics
    unset ytics
    unset ztics
    splot "< hexdump -f gnuplot.hdp random.data" using ($1):($2):($3) notitle
    

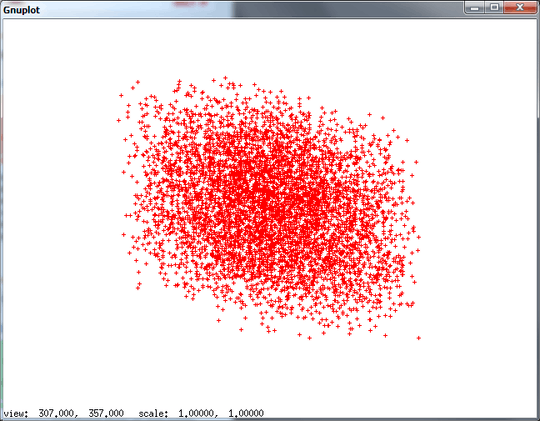
    A file with random numbers shows -- not surprisingly -- a rather random scatter plot:

    enter image description here

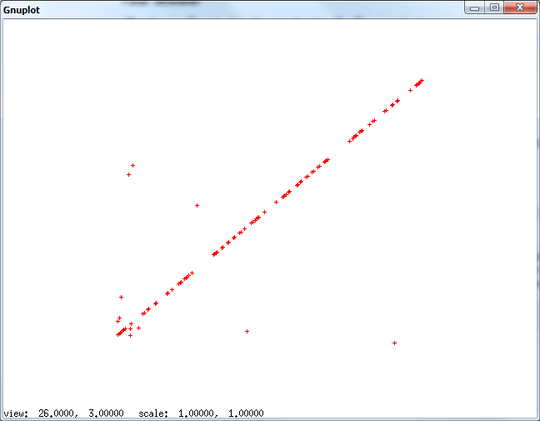
    But if we use e.g. a badly compressed file, like a simple bitmap, we see a structure (here it's a line):

    enter image description here

  3. If we want to resemble the plot in the cited article a little better, we need 6/1 "%03d " "\n" as hexdump format, so that we get six bytes per line. And we have to extend the splot command in gnuplot:

    splot "< hexdump -f gnuplot.hdp random.data" u ($1-$2):($2-$3):($3-$4) ls 1 not, '' u ($2-$3):($3-$4):($4-$5) ls 1 not, '' u ($3-$4):($4-$5):($5-$6) ls 1 not
    

    gnuplot treats u as an abbreviation for using and not for notitle to keep things short.

    For the bitmap we get now a nice looking object;

    enter image description here

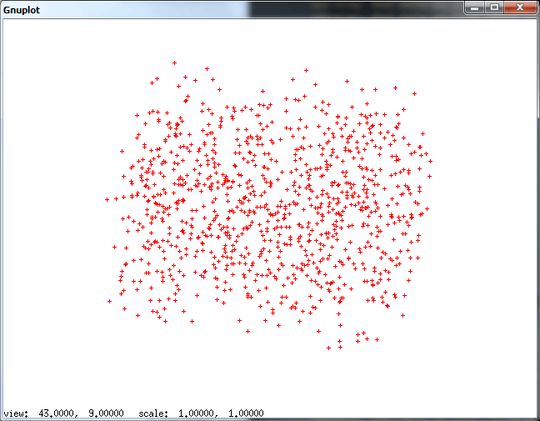
    the random data looks like that:

    enter image description here

  4. Be aware, that we analyze the data in blocks of 6 bytes, i.e. if only the 6th and 7th byte (or multiples of these) are correlated, the plots won't reveal that.

  5. gnuplot should handle a 10MB input file easily, but especially the rotation can get slow -- depending on your computing power.

mpy

Posted 2013-07-26T16:29:05.060

Reputation: 20 866

This answer to the same question may be of interest to you. – Schorsch – 2013-08-07T15:25:51.593