Understanding top command in unix

42

25

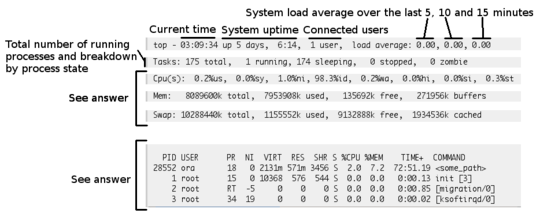
When I run top -c command on my UNIX box I get the output below:

top - 03:09:34 up 5 days,  6:14,  1 user,  load average: 0.00, 0.00, 0.00
Tasks: 175 total,   1 running, 174 sleeping,   0 stopped,   0 zombie
Cpu(s):  0.2%us,  0.0%sy,  1.0%ni, 98.3%id,  0.2%wa,  0.0%hi,  0.0%si,  0.3%st
Mem:   8089600k total,  7953908k used,   135692k free,   271956k buffers
Swap: 10288440k total,  1155552k used,  9132888k free,  1934536k cached

  PID USER      PR  NI  VIRT  RES  SHR S %CPU %MEM    TIME+  COMMAND                                                                                                                                           
28552 ora       18   0 2131m 571m 3456 S  2.0  7.2  72:51.19 <some_path>
    1 root      15   0 10368  576  544 S  0.0  0.0   0:00.13 init [3]
    2 root      RT  -5     0    0    0 S  0.0  0.0   0:00.85 [migration/0]
    3 root      34  19     0    0    0 S  0.0  0.0   0:00.02 [ksoftirqd/0] 

How can I analyze the system based on this output? What is the difference between Mem and Swap? I am new to UNIX and tried the man page for this command but I cannot understand how to analyze this data.

user2065083

Posted 2013-03-29T11:23:39.860

Reputation: 533

please googlize before asking your question

http://wiki.answers.com/Q/What_is_difference_between_swap_and_ram

– Sencer H. – 2013-03-29T11:57:58.103

Mem means RAM Memory, Swap Means Swap partition or Swapfile. Swap means suppose if your RAM gets full, it will move some unused process to Swap partition, At this time your RAM gets somewhat free, If later RAM needs that process, then it will move back that process from Swap partition to RAM. – max – 2013-03-29T12:20:50.677

2I really like htop, which roughly does the same as top but then better. – Paul Hiemstra – 2013-03-30T16:30:24.670

Answers

80

All this information is available in the top man page which you can read by running man top. Here is a breakdown:

enter image description here

  • The CPU(s) row shows:

    CPU state percentages based on the interval since the last refresh. Where two labels are shown below, those for more recent kernel versions are shown first.
    us, user : time running un-niced user processes
    sy, system : time running kernel processes
    ni, nice : time running niced user processes
    wa, IO-wait : time waiting for I/O completion
    hi : time spent servicing hardware interrupts
    si : time spent servicing software interrupts
    st : time stolen from this vm by the hypervisor

  • The Mem and Swap rows show:

    This portion consists of two lines which may express values in kibibytes (KiB), mebibytes (MiB) or gibibytes (GiB) depending on the amount of currently installed physical memory.

    Line 1 reflects physical memory, classified as: total, used, free, buffers

    Line 2 reflects virtual memory, classified as: total, used, free, cached

    Physical memory is your RAM, physical pieces of hardware that provide Random Access Memory. Swap is virtual memory which can be a file or a partition on your hard drive that is essentially used as extra RAM. It is not a separate RAM chip though, it resides on your hard drive.

  • The last section provides information about the currently running processes. It consists of the following columns:

    1. PID -- Process Id : This is a unique number used to identify the process.
    2. User : The username of whoever launched the process.
    3. PR -- Priority : The priority of the process. Processes with higher priority will be favored by the kernel and given more CPU time than processes with lower priority. Oddly enough, the lower this value, the higher the actual priority; the highest priority on *nix is -20 and the lowest is 20.
    4. NI -- Nice value : nice is a way of setting your process' priority. See here for more details.
    5. VIRT -- Virtual Memory Size (KiB) : The total amount of virtual memory used by the process.
    6. RES -- Resident Memory Size (KiB) : The non-swapped physical memory a task has used.
    7. SHR -- Shared Memory Size (KiB) : The amount of shared memory available to a task, not all of which is typically resident. It simply reflects memory that could be potentially shared with other processes.
    8. S -- Process Status : The status of the task which can be one of:

      • 'D' = uninterruptible sleep
      • 'R' = running
      • 'S' = sleeping
      • 'T' = traced or stopped
      • 'Z' = zombie
    9. %CPU -- CPU Usage : The percentage of your CPU that is being used by the process. By default, top displays this as a percentage of a single CPU. On multi-core systems, you can have percentages that are greater than 100%. For example, if 3 cores are at 60% use, top will show a CPU use of 180%. See here for more information. You can toggle this behavior by hitting Shifti while top is running to show the overall percentage of available CPUs in use.
    10. %MEM -- Memory Usage (RES) : A task's currently used share of available physical memory (RAM).
    11. TIME+ -- CPU Time, hundredths : Total CPU time the task has used since it started.
    12. COMMAND -- Command Name or Command Line : To see the full command line that launched the process, start top with the -c flag : top -c.

terdon

Posted 2013-03-29T11:23:39.860

Reputation: 45 216

1

  • Mem refers to your RAM.
  • Swap is a disk partition (or file) the system uses as an extension to you memory. Data that was not recently used can be moved (swapped) to disk to free your RAM. In case the system needs it again, it will swap it back. See http://en.wikipedia.org/wiki/Paging for details.

Matteo

Posted 2013-03-29T11:23:39.860

Reputation: 6 553