0
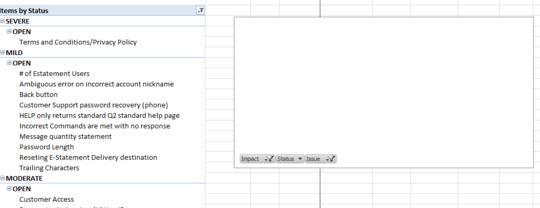
My Pivot Table has everything I want however,I want my chart to show how many Issues have the status of severe, mild, or moderate. But instead it is blank.

What should I do?
0
My Pivot Table has everything I want however,I want my chart to show how many Issues have the status of severe, mild, or moderate. But instead it is blank.

What should I do?
0
Just drag the "Issue" field to the data section. There it will be counted and display in your chart.
If you want to see both, the count in each section as well as a detailed list, you'll need two pivot tables - the one you have already for the breakdown and the one I described above for the charts. Of course you can hide the pivot table with the counting, as I guess only the chart will matter...