14
9
Someone asked me to get a call stack or stack trace of a running process so that he could analyze it for me.
How can I get that information?

Der Hochstapler
Posted 2012-08-17T19:11:20.003
Reputation: 77 228
14
9
Someone asked me to get a call stack or stack trace of a running process so that he could analyze it for me.
How can I get that information?
Der Hochstapler
Posted 2012-08-17T19:11:20.003
Reputation: 77 228
35
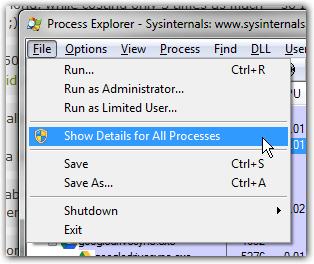
Get Process Explorer.
Enable Show Details for All Processes from the File menu:
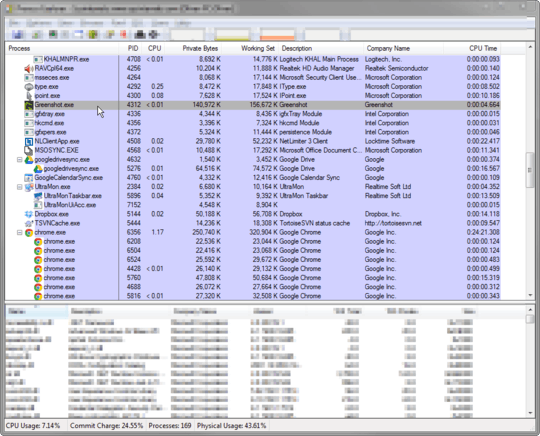
In the main pane, select the process you're interested in:
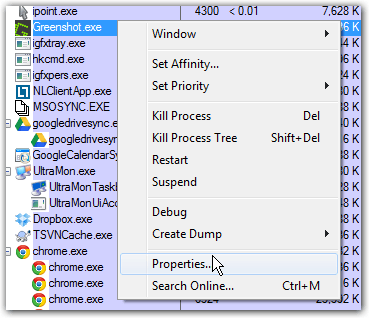
Open the context menu (right-click) for the selected process and click Properties:
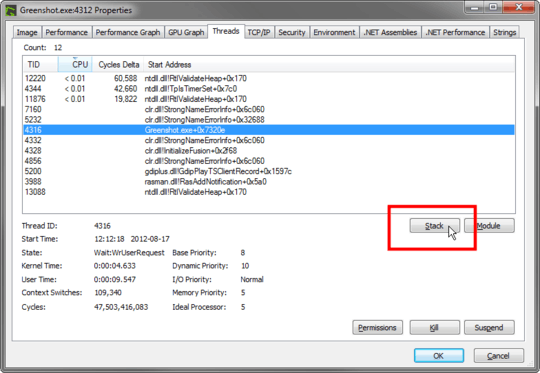
On the Threads tab, you'll be able to see a list of the running threads inside that process:
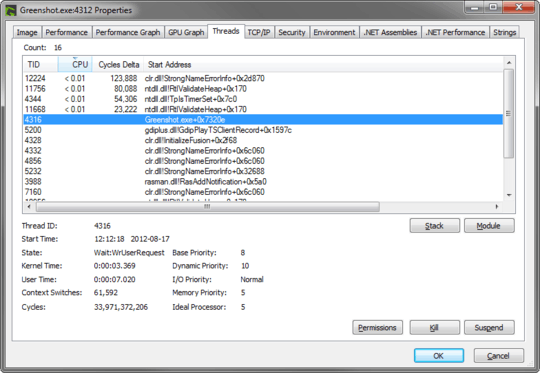
Select the thread you're interested in and click the Stack button:
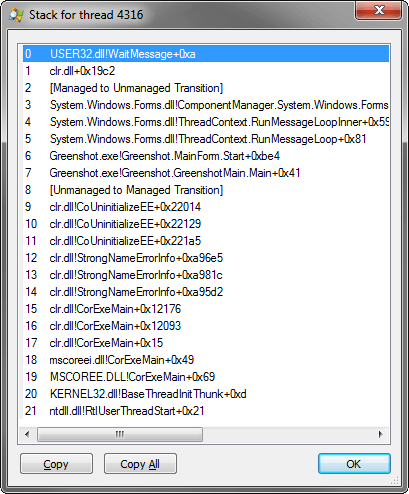
Process Explorer will now display the current call stack for the selected thread:
If your troubleshooting requires you to get more detail, it is often very helpful to load debugging symbols into Process Explorer. This is how:
If you don't already have a Windows debugger installed, you're going to have to install the Debugging Tools for Windows first.
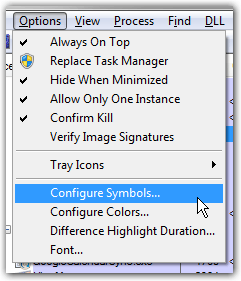
In Process Explorer, open Configure Symbols... from the Options menu:
If you have the Debugging Tools (or another Windows debugger) installed, Process Explorer will automatically find the dbghelp.dll file. Otherwise, set the correct path here.
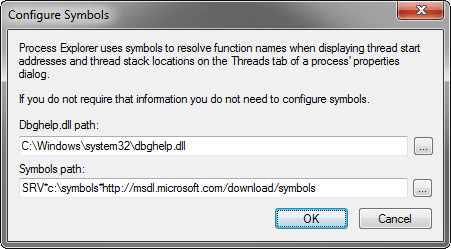
The Symbols path should look something like:
SRV*C:\Symbols*http://msdl.microsoft.com/download/symbols
The only part you'll want to adjust is C:\Symbols. That's the location where the debugging symbols will be cached.
Der Hochstapler
Posted 2012-08-17T19:11:20.003
Reputation: 77 228
is there a way to dump all threads call stacks to file? – bgura – 2017-06-23T14:00:40.810