0
In my trading software I write myself logs like this:
634782126998342815 q 0.0156327559515302
634782126998966816 q 0.0156323845819952
634782126999122816 q 0.0156323423136646
634782126999278816 q 0.0156323634478013
634782126999434817 q 0.0156321895228581
634782126999434817 q 0.015632316326057
634782126999434817 q 0.0156320680833289
634782126999434817 q 0.0156319412841572
634782126999434817 q 0.0156320680833289
634782126999434817 q 0.0156321541605791
634782126999902817 b 0.0156321229489328
634782126999902817 q 0.0156319988296541
634782126999902817 q 0.0156318739862979
634782126999902817 q 0.0156319488920723
- First column is time (it's so big because this is number of ticks elapsed from 1970 where one tick = 100 nanoseconds, just don't worry about that)
- Second column is operation. Either q for quote b for buy and s for sell.
- Third column is price.
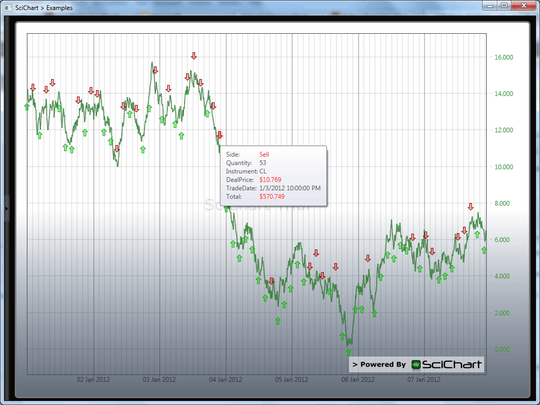
Lines with the same time should form a vertical candle. Also I need to add annotations on the graph to show where I buy and sell stocks.
Without annotations I think this task is trivial for Matlab, but can I add annotations in Matlab? i.e. I want to have something like this:
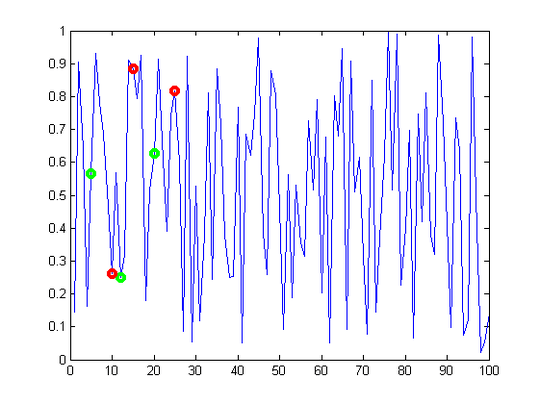
When I buy stock I want to display a green arrow and when I sell stock I want to display a red arrow. It's OK to use other symbols until they are clear and distinguishable.


