20
2
I've got a value associated to each day, as such:
120530    70.1
120531    69.0
120601    69.2
120602    69.5
# and so on for 200 lines
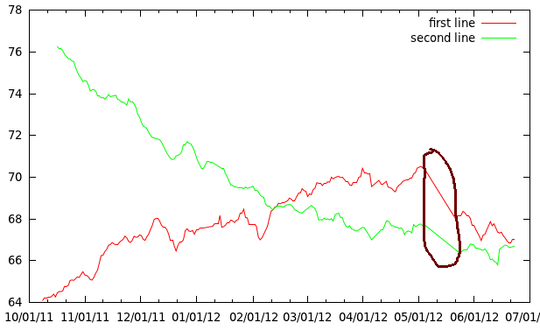
When plotting this data in gnuplot with lines, the data points are nicely connected. Unfortunately, at places over a week of data points can be missing. Gnuplot draws long lines over these intervals. How can I make gnuplot only connect points on consecutive days?
Solutions that require preprocessing of the data are fine, as I already smooth it with a script.
Here is what I use:
set xdata time
set timefmt "%y%m%d"
plot "vikt_ma.txt" using 1:2 with lines title "first line", \\
     ""            using 1:3 with lines title "second line"
Example:

Here is a picture of the problem: http://i.stack.imgur.com/aYH4N.png (can't add images to the post for some reason). I want the circled area to be left blank.
– Anna – 2012-06-24T15:05:28.663Welcome to superuser. You can't because you just have not yet gathered enough reputation on this site. If you are unhappy with my changes you can of course revert them (or edit again). – Baarn – 2012-06-24T15:09:56.120