3
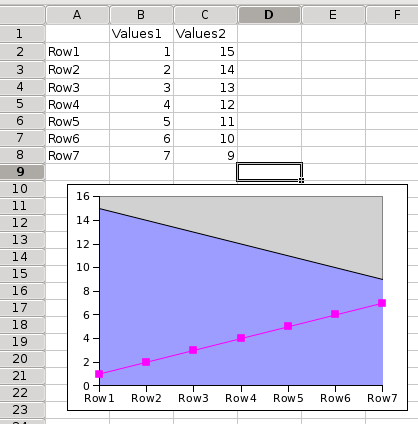
Is there a way to create a graph that is a combination of lines and areas in OpenOffice Calc?
Currently the only way I know how is to make two charts, make the background of one transparent, and lay it on top of the other. But keeping them lined up spacially is a complete hassle and doesn't ever fully work.

Questioner
Posted 2012-03-14T08:06:08.667
Reputation: 618