0
I have the following as an example.
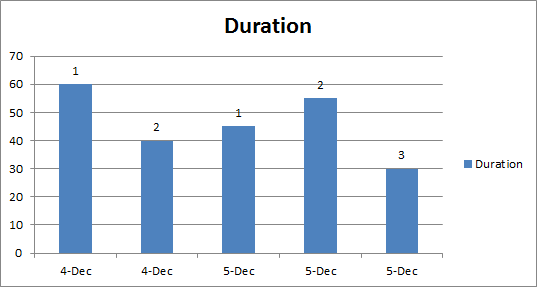
Date    Duration    Shift
4-Dec   60          1
4-Dec   40          2
5-Dec   45          1
5-Dec   55          2
5-Dec   30          3
I am trying to map these either on a bar or line/scatter graph and basically have Duration be Y and Date be X and map which shift for each. I can't seem to remember how to do it.

Unfundednut
Posted 2011-12-06T14:43:30.640
Reputation: 6 650

What do you mean by "map which shift for each"? A label? – Rachel Hettinger – 2011-12-06T15:03:40.563
Sorry, still early for me :) Basically I want the Y to be Duration but yes be labels as the Shift so I can see for Dec 5 in bar graph which shift took longer for the setup. – Unfundednut – 2011-12-06T15:06:32.120