7
I have the following graphviz graph:
digraph finite_state_machine {
    a -> b [ label = "c" ];
}
The output of this graph should be
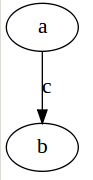
And this is indeed what I get if I try to use dot to generate a file (e.g. by dot -Tsvg test.dot > test.svg).
When I try to use dotty to display it, however, all the labels appear as periods:
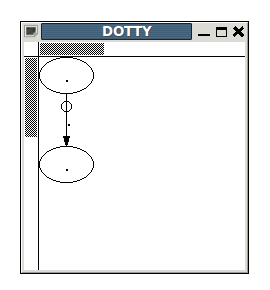
What causes this problem, and how can I solve this? I have used dotty a lot in the past on similar graphs, both on Windows and on Linux, and never saw this behavior.
Ubuntu 10.04.3 LTS, Graphviz version 2.20.2 (dotty version 96c).

Oak
Posted 2011-09-12T12:02:36.043
Reputation: 1 255


1Are the right fonts installed? – Sardathrion - against SE abuse – 2011-09-12T13:17:12.203
@Sard I don't know, how can I check? – Oak – 2011-09-12T13:18:45.717
Have a look at $HOME/.xsession-errors and/or /var/log/Xorg.0.log to see if there are errors there. Start dotty in a console (so you can see any messages send to stderr). Look at what fonts you have installed and force a font in the dot file to see if it makes any difference. – Sardathrion - against SE abuse – 2011-09-12T14:09:44.670
1sounds like a missing font to me. – RobotHumans – 2011-09-20T14:30:26.150