It is possible to get the code that generates the graphics you added using the drawing tools.
For example, here's a quadratic where I've used the drawing tools to add in arrows to the x-intercepts:
Plot[x^2 - 4, {x, -3, 3}]

After the graphics type // InputForm to see the code that makes the graphics. In this case I've also used /. Line[x_] -> Line to suppress all of the points that make up the plot:
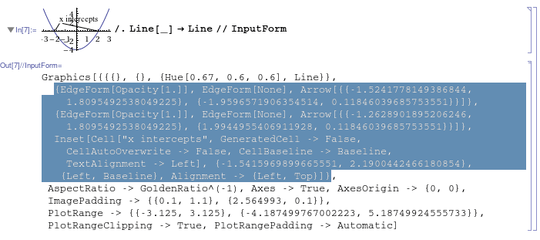
The highlighted code is that which was added by the drawing tools. It can be simplified (e.g., remove the EdgeForm commands and replacing the Inset Cell with just a plain Text command) when you add it back to your original Plot, which can be done with an Epilog (or a Prolog) or by using Show.