2
1
I'm doing some serious performance testing on the binary file parser I'm writing at work. After implementing multiprocessing to greatly speed up parsing, I turned to focus on reducing the memory footprint, which can become significant with hundreds of thousands of files. So, yesterday I set up an extremely low-tech Python memory profiler (Run tasklist as a system command, redirected to a file, read and parse the file) and set it to work to see if I had any memory leaks that slowly built over time. Here are the results.
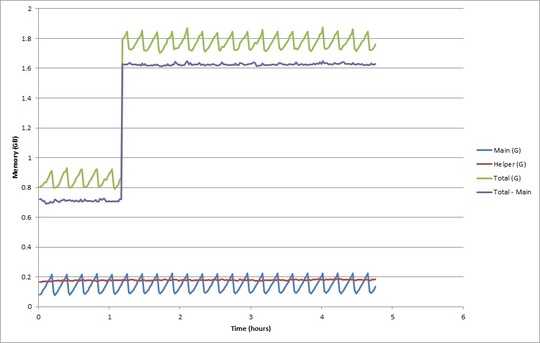
The answer to my question appears to be no, or at least not appreciably. (It saves results to a shelve file every few thousand, hence the sawtooth pattern) But obviously the first thing I noticed was the 900 MB jump, which all happened sometime within a roughly 90-second interval. It reminded me of another occurrence I recorded my first time doing this high-volume test:
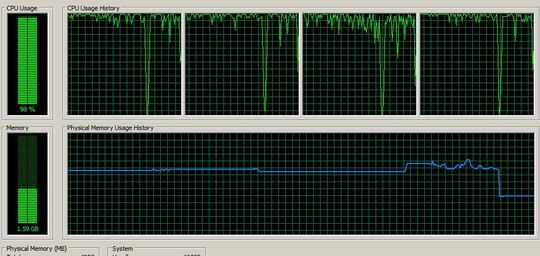
Only in reverse, of course. Both times there's a nearly 1 GB jump in memory usage. This doesn't appear to have anything to do with my program, so I probably shouldn't worry too much about it. But does anyone know what could be causing this?
UPDATE: I ran the massive parse session again, keeping regular tasklist logs, monitoring RAM usage, and using RamMap. tasklist didn't find anything unusual that could account for creeping RAM usage. (The Excel graph not finding anything) But using RamMap I think I found the culprit. Looking at snapshots of my memory usage before and after the massive discontinuity (which happened right as my program exited this time), I saw that the "Mapped file" category was using all the extra memory. Specifically, the temp file my program was creating (which had grown to well over 1 GB) was dominating the memory usage of this category; in the "File Summary" tab it was using over 1 GB. I modified my program to save results in this file specifically to avoid using excessive memory, so it's unfortunate that it still somehow is. Is this because I was not closing the file in between uses? Will opening it always load the entire thing into memory? (It was created with Python's shelve module to store mapped data) This still probably doesn't answer the question of what happened in the Excel chart, but it's a problem I've been dealing with all week.

dpitch40
Posted 2011-08-11T14:32:24.253
Reputation: 169

Well, the application isn't responsible for the huge jump in memory usage--something else is going on. – dpitch40 – 2011-08-11T15:16:41.547