10
1
This question is halfway between physics and "computer software". I decided to start asking here.
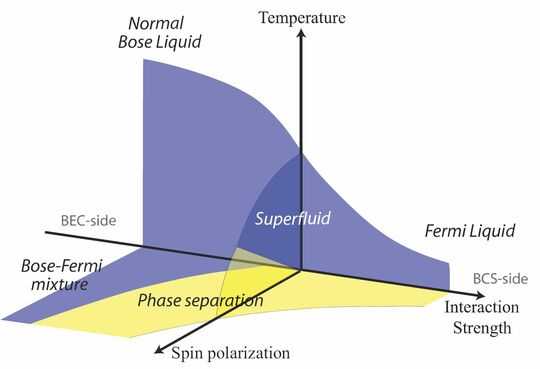
I'd like to create a 3d phase diagram similar to this one:
For the moment, my only choice is tikz-3dplot but I'm quite frightened by that way!
Maybe you've some other ideas or a (Linux) tool to suggest me?

Pie86
Posted 2011-03-31T09:29:45.847
Reputation: 201


I have a similar dilemma. But it seems there really is nothing better than tikz for these purposes. You just have to get used to thinking about drawing in an algorithmic way, which is never easy. But there was also a time when Latex seemed impenetrable so I have hope :) – space_cadet – 2011-03-31T10:06:37.253
1Asymptote perhaps? I don't have any experience with it but I hear it's similar to metapost, so it should be doable. – None – 2011-03-31T12:22:34.960
not directly physics-related question, but its of interest to physicists, so i give +1, since there isn't (for the foreseeable future) a physicists.stackexchange.com site. – None – 2011-03-31T16:11:21.300
2It's really not physics related at all (the chart could be any other 3D graphic and the question would be the same). If we had a computergraphics.SE, it would be a perfect fit there, but for now the best place for it is Super User. – David Z – 2011-03-31T17:30:16.840