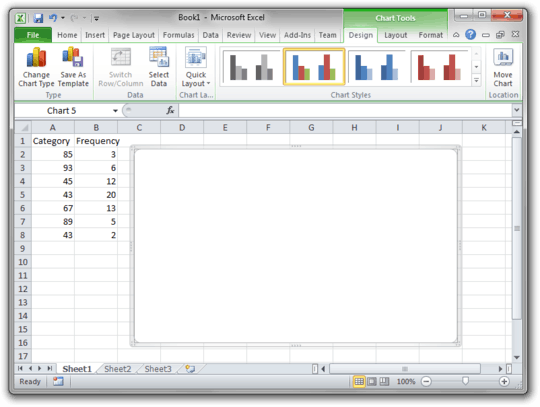
Lay out your data in the following format:
Category        Frequency
 85           3
 93           6
 45           12
 43           20
 67           13
 89           5
 43           2
Start by inserting a new blank chat. Do not select any data. I would suggest using a column chart for this. Just go to Insert -> Chart -> Column -> 2D Column. It should be blank:
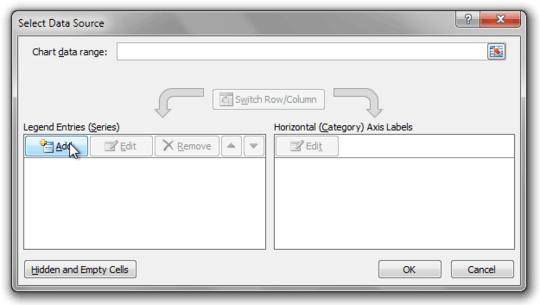
On the Design tab of the Chat Tools section of the Ribbon, click on Select Data. Under legend entries, click Add.
Select the Series Values box (not the "Series Name" box), and click+drag to select all of the data in the frequency column.
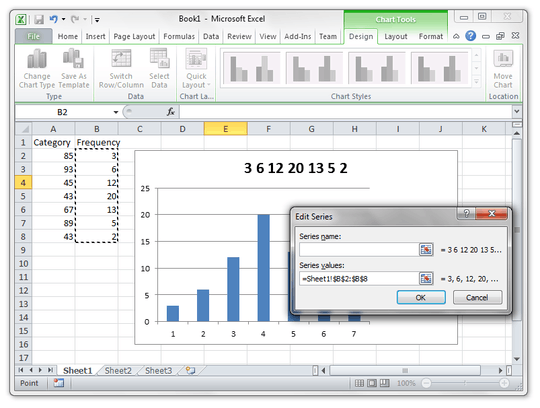
Click OK. Now, back in the Select Data dialog, click Edit on the "Horizontal Axis Labels".
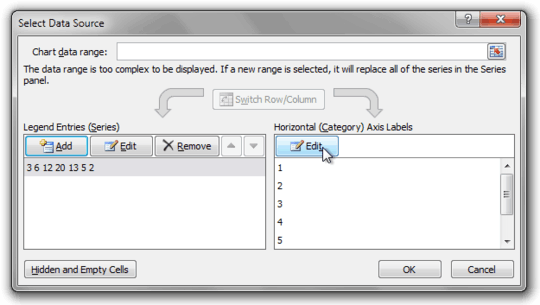
Click+drag to select the Category column:
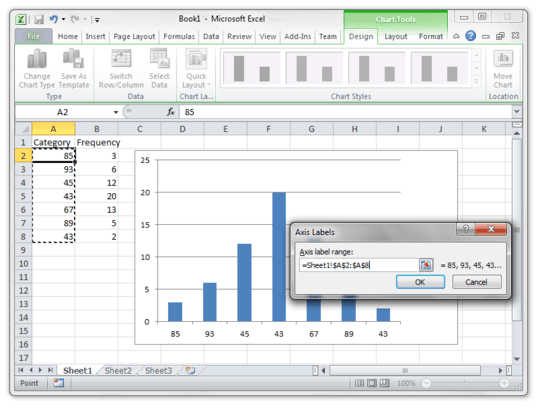
Now click OK on everything and set whatever other legend, title, and other settings you wish!


I feel like an idiot for not spotting that. Good post. – James Mertz – 2011-03-23T06:16:28.980
1nhinkle: what are you using for those screenshots? I usually use the Windows 7 Snipping Tool, but the results aren't usually that clean. – TuxRug – 2011-04-10T04:31:50.930
@TuxRug, I use Shotty, as suggested in "Free screenshot program that respects Aero's transparency layer". It doesn't always work perfectly, but most of the time, it does a great job of capturing nice clean screenshots with transparent windows and window shadows.
– nhinkle – 2011-04-10T04:54:47.290In Windows, you can also use the shortcut ctrl+shift+printscreen @TuxRug which will take a screen shot of the currently active window. – James Mertz – 2011-04-12T12:51:48.597
@KronoS: yes, but not as nice-looking. – TuxRug – 2011-04-12T18:51:55.643