venn generating software

0

I need venn generating software for Creating venn diagrams and Animations for venn diagrams.

its should be free ;-)

joe

Posted 2009-07-29T15:47:19.613

Reputation: 11 615

Question was closed 2014-12-30T14:45:32.240

Please can you be more detailed with your questions? One line questions are less likely to get answers. – BinaryMisfit – 2009-07-29T15:48:17.770

Answers

4

Easy Venn Diagram Software

Create great-looking Venn diagrams, marketing charts, and more in minutes with SmartDraw.

enter image description here

  • Automatic Drawing
  • Click simple commands and SmartDraw builds your Venn diagram for you, automatically.
  • Automatic Formatting
  • Add or remove a shape, and SmartDraw realigns and arranges all the elements so that everything looks great.
  • Quick-Start Templates
  • Dozens of professionally-designed Venn diagram examples make you instantly productive. - - Simply choose the template that is most similar to your project, and customize it to suit your needs.
  • Free Support

Or should it be webbased?

Ivo Flipse

Posted 2009-07-29T15:47:19.613

Reputation: 24 054

is it possible port that into Web pages and i can able to create the venn diagram with animation mode – joe – 2009-07-29T16:06:52.507

Krish, how do you mean port into a webpage? If it's an image, off course you can. Do you want a web based Venn generator? – Ivo Flipse – 2009-07-29T16:12:48.813

1

Google Chart API for Venn diagrams

Specify a venn diagram with

cht=v

Supply one data set where:

  • The first three values specify the relative sizes of three circles: A, B, and C.
  • The fourth value specifies the area of A intersecting B.
  • The fifth value specifies the area of A intersecting C.
  • The sixth value specifies the area of B intersecting C.
  • The seventh value specifies the area of A intersecting B intersecting C.

Description:

  • In this example, the value 100 specifies the first circle, the value 80 specifies the second circle, and the value 60 specifies the third circle. The values 30, 25 and 20 specify the areas of overlap between each pair of circles. The value 10 specifies the area of overlap between all three circles.For information on available parameters for Venn diagrams, see Optional parameters by chart type.

Example:

enter image description here


For your information:

Developer's Guide

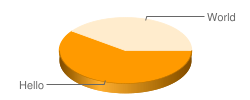
The Google Chart API lets you dynamically generate charts. To see the Chart API in action, open up a browser window and copy the following URL into the address bar:

http://chart.apis.google.com/chart?cht=p3&chd=t:60,40&chs=250x100&chl=Hello|World

Press the Enter or Return key and - presto! - you should see the following image:
enter image description here

Ivo Flipse

Posted 2009-07-29T15:47:19.613

Reputation: 24 054

I'm no expert in Google Code things, but I'm sure you can use a chart generator from their site – Ivo Flipse – 2009-07-29T16:21:51.073