0
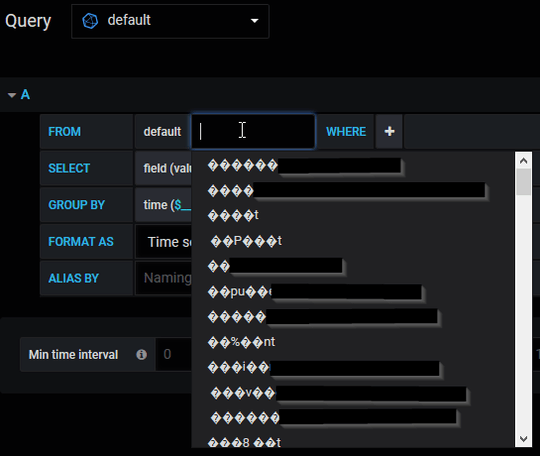
I have a weird behaviour on my Grafana/InfluxDB setup:
What happened: Apparently after an upgrade from version 6.4.3 to 6.4.4 Grafana shows weird encodings in the measurement drop down in the query editor.
I am not entirely sure from where the issue arises but currently the only change I see is the version upgrade of Grafana some days ago.
Environment:
- Grafana version: 6.4.4 (
commit: 092e514, branch: HEAD) - Data source type & version: InfluxDB v1.7.9 (
git: 1.7 23bc63d) - OS: Debian 10.2
- Data Source: Icinga 2 (r2.11.2-1)
- User OS & Browser: Windows 10, Firefox 70.0.1 (64bit)
Any ideas or troubleshooting hints are welcome. Thanks guys!
