2
2
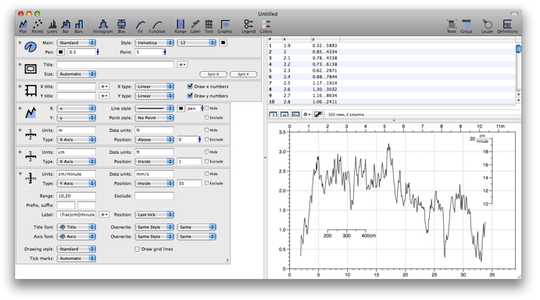
Recently, on a friend's Mac I came across a wonderful application for plotting in numerous ways numeric data - DataGraph. I've always done this sort of thing with Excel, and with newer versions, to me (this is emphasized "to me", so this doesn't get taken as an Excel rant post), it's becoming troublesome.
Are there applications like this (specialized for one thing they do good and relatively simple ... I'm not interested in CFD visualization packages in here.) for Windows? All suggestions welcomed.
p.s. GUI applications ! Not interested in plotting libraries either.

Rook
Posted 2010-05-10T18:37:03.113
Reputation: 21 622


1Hardly the same ... even by a longshot. No interface, always meddling with syntax, getting different kinds of plots means writing different programs ... it may be nice to someone who knows it's syntax by heart, but to people who just want to get the graph with no extra fuss, it is a world of difference. – Rook – 2010-05-10T19:16:05.950
front ends are available. No need to learn syntax by heart, just find what you need. – bryan – 2010-05-10T19:32:46.747
could you provide some examples ? – Rook – 2010-05-10T20:33:00.677
I used it a couple of years ago, and don't have the sample data or scripts to hand, but I know it didn't take more than a few mins. And one of the the great things is that the resolution of the graph is only dependent on the source data. Some simpler tools can't achieve this. – bryan – 2010-05-10T20:51:39.220
No. I mean, examples of frontends. I've used gnuplot before as a plotting library in some of my programs. But it's not what I'm looking for now (in that way, anyway). – Rook – 2010-05-10T22:24:42.990