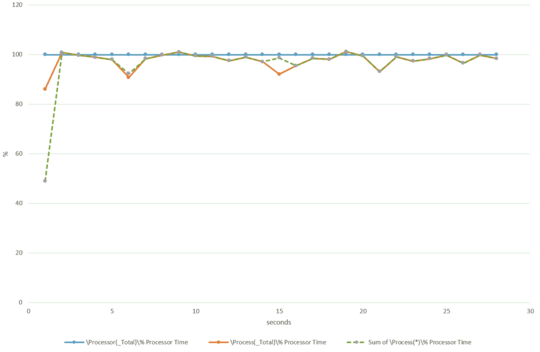
The discrepancy between total processor time ( \Processor(_Total)\% Processor Time ) used and the total of the processes CPU time ( Process(_Total)\% Processor Time
\Process(_Total)\% Processor Time ) is likely due to time spent at elevated IRQL. This appears in PerfMon as "% Interrupt time" and "% DPC time".
Interrupt time is time spent in interrupt service routines or serialized with them; such code runs at IRQL 3 and above. DPC time is time spent in "DPC routines", or code serialized with them; such code runs at IRQL 2. DPC routines are mainly used to handle work that is triggered by an interrupt but need not be done in the same serialization context as the ISR.
The discrepancy exists because CPU time spent at DPC level or higher does get included in total processor time, but not in the CPU time for any thread or process. This is because such code is not necessarily associated with the current thread's activities, so there is no point in "charging" the current thread for that time.
The slight difference between \Process(_Total)\% Processor Time and the sum of \Process(x)\% Processor Time for all running processes is likely due to data collection issues in PerfMon. You see, there is no process object called "_Total" and no set of CPU usage counters to go with that concept. PerfMon calculates this total simply by adding up the CPU times for each process that exists at the moment of collection. Similarly, the CPU time percentage for all of the processes are not collected at the same instant. It is therefore possible for slight "slippages" to occur between the total observed by PerfMon and the total you'll get when you add up all of the counters you see in the display.

Please provide some information about how big the discrepancy is. Currently it might just be a rounding error. – Seth – 2018-03-15T13:19:09.337
Hi @Seth! I've added a quick Excel graph to my question. – Bowi – 2018-03-15T13:33:03.767