3
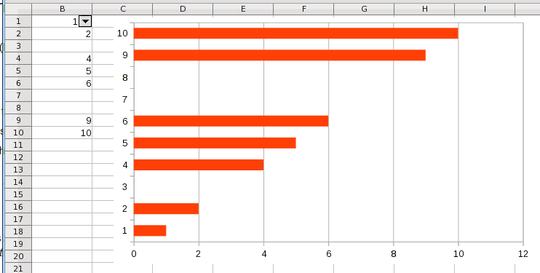
The task I am trying to get done is the following (hope I am able to clarify what I mean):
- LibreOffice 5.0.5.2
- 1024 rows of data in a Calc sheet
- ~256 lines with excerpts of the data right of the original
- these excerpts are shown (or not shown) based on a flag in the same row
- these flags are set by conditions I want to change several times to plot several different scenarios
- every time the flags change, another subset of the 1024 rows will have data in them at the right side
- this data shall be plotted in a bar chart
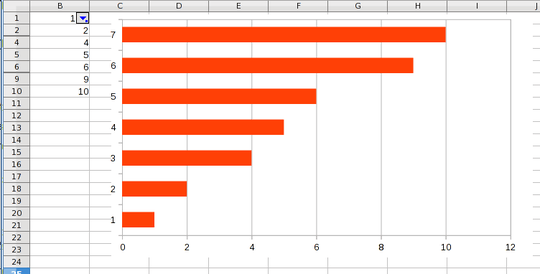
I do not want to select ~256 by hand, but instead I want to select the whole block on the right and tell LibreOffice use only the rows with data in it to plot and ignore the rest
(Ideally I would tell this only one time, then change the flags and the diagram would get updated with the now filled rows)
Any suggestions what I might have overseen and how to accomplish this task?


>
1.) bar chart with % would be great – Jaleks – 2016-10-10T20:42:34.910