1
I got the program to work, but I can't seem to figure out how to get boot events. I tried actions, but Microsoft's documentation is severely lacking.
I was able to use the boot manager with the following command:
xbootmgr -trace rebootCycle -noPrepReboot -traceFlags BASE+CSWITCH+DRIVERS+POWER+REGISTRY -resultPath C:\
This works, but I can't seem to find out how much time it took to boot the system. In BootVis, this was really easy and it showed you explicitly when the boot process was completed and what took up that processing time. In the new version in Microsoft Windows Performance Toolkit, it doesn't seem to be that easy but maybe I'm missing something.
How do I know when the boot process is done?
Update: I have been looking more and more at those graphs and charts with no luck of finding a definitive boot time (not time since last boot, but the time it took to boot up the system). Does anyone actually use this tool? It seems like no one is interested in this issue at all!
Update 2: Here is a screenshot of how easy it is in BootVis:
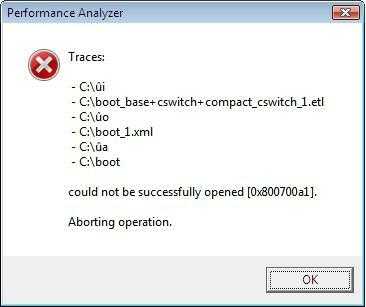
Now when I run xperf –i "boot_base+cswitch+compact_cswitch_1.etl" –o boot_1.xml –a boot" I get the following error:

Brian T Hannan
Posted 2010-02-04T18:38:25.900
Reputation: 891
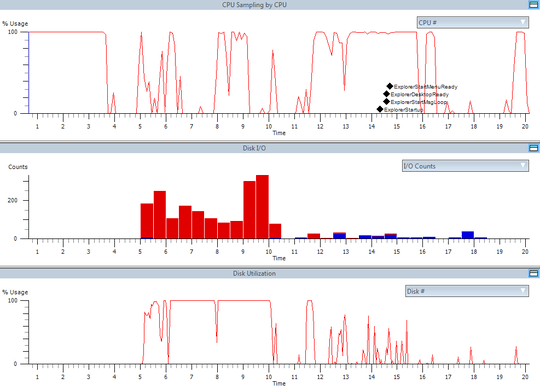


I don't see ExplorerStartMenuReady, etc ... in my CPU Sampling by CPU diagram! Any reason this might happen. Also, when I run the command to generate the XML file I got an error, see the new image in my post. – Brian T Hannan – 2010-02-16T22:41:09.807
BTW, you are close to getting the bounty points for this if I can just get either of the two to work properly. – Brian T Hannan – 2010-02-16T22:41:36.933
For the Explorer marks right click on CPU graph and choose Overlay Graph / Marks / Mark. This will only work with traces taken on XP. The proper and more flexible way is to generate the XML output. Make an empty folder (eg. C:\Traces) run Xbootmgr and Xperf from there. Use the resulting .etl file as an input parameter to Xperf. – Ryck – 2010-02-17T10:15:54.777
I thought this tool was only for Vista and Win7? – Brian T Hannan – 2010-02-17T16:15:48.787