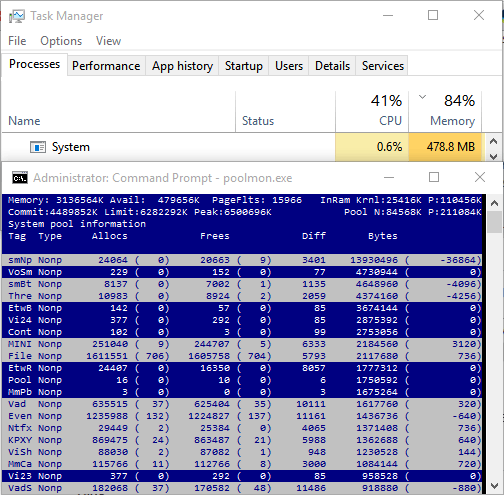
I've looked at xperf traces of several users and here the function ntoskrnl.exe!SmKmStoreHelperWorker of the Kernel starts to allocate memory.

(Click image to enlarge)
I discovered this on sysinternals.
I've asked Microsoft about it and the answer is that this is by design. It is related to System Memory compression.
In the announcement of Windows 10 Build 10525, Microsoft explained it a bit:
In Windows 10, we have added a new concept in the Memory Manager
called a compression store, which is an in-memory collection of
compressed pages. This means that when Memory Manager feels memory
pressure, it will compress unused pages instead of writing them to
disk. This reduces the amount of memory used per process, allowing
Windows 10 to maintain more applications in physical memory at a time.
This also helps provide better responsiveness across Windows 10. The
compression store lives in the System process’s working set. Since the
system process holds the store in memory, its working set grows larger
exactly when memory is being made available for other processes. This
is visible in Task Manager and the reason the System process appears
to be consuming more memory than previous releases.
So instead of writing memory data to the pagefile it compresses them. And this compressed memory is shown in the System process.
Microsoft also posted more details in the inside hub. Winbeta created a article which includes more details.
Apparently, the reason for this happened to do with Microsoft choosing
to suspended UWP apps when they were not in the foreground, very
similar to some smartphone OS management. Windows 8 users understood
(perhaps not) that if apps weren’t on screen, they wouldn’t run until
the user switched back to them. The ‘all or nothing’ approach is being
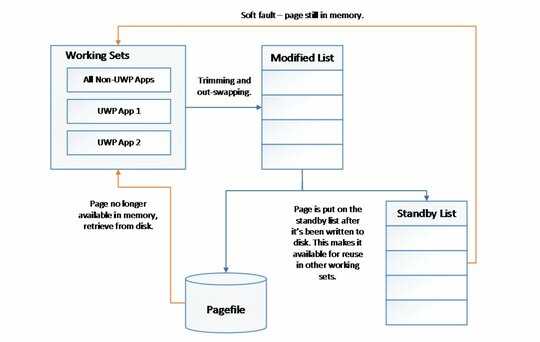
updated with Windows 10 introducing a layer between the pagefile and
normal paging activity. Now, when faced with memory pressure issues,
MM will determine which pages should be moved to the modified list in
a process called trimming. The modified list is a secondary list of
pagefiles backing up a list of standby pagefiles. A backup list is
captured in case memory is reclaimed from the standby list by another
process, and the original process comes looking for its page. Instead
of all or nothing, Windows 10 MM will compress unused pages rather
than writing them to disk. With less writing, the result should be
fewer disk operations – thanks to the compression – and now more data
can be stored in memory.
According to the Windows team, “In practice, compressed memory takes
up about40% of the uncompressed size, and as a result of a typical
device running a typical workload, Windows 10 writes pages out to disk
only 50% as often as previous versions of the OS.” If all goes
according to plan, Windows users could be experiencing reduced waiting
times for all devices as well as extended lifespans on systems that
have flash-based hard drives.
Decompression is also something Windows 10 is designed to do well.
Windows 10 is using the combination of parallelizability and
sequential reads to produce pages into memory once called. The new
decompression should result in a speedier experience as Windows 10 is
simultaneously decompressing data and reading it in parallel using
multiple CPUs. Older versions of Windows may have felt sluggish
because of the transfer rates between the disk.
Microsoft also released a Video on channel9 which explains the feature.
Memory Compression in Windows 10 RTM
https://channel9.msdn.com/Blogs/Seth-Juarez/Memory-Compression-in-Windows-10-RTM
In this video Mehmet Iyigun spent some time discussing why the System
process in Windows 10 is taking a bit more memory and why it's a good
thing. A process taking more memory sounds like a bad thing - that is
until I understood more about memory management, paging, and hard /
soft page faults. Turns out that that the OS is doing some clever
optimizations that allow your processes to trim some of the memory but
not necessarily page it out to disk. Not only is the memory preserved
in RAM, but it is also compressed - making hard page faults a more
rare occurrence. The results should make for a snappier experience.
In the latest TH2 Builds, Microsoft updated the description in the task manager and now also shows that the SYSTEM process hosts the compressed memory:

to avoid confusions about the "high" usage.
In the Window 10 Anniversary Update which was released in August 2016, Microsoft extracted the Compression into now shown in a pseudo process called Memory Compression to no longer confuse users why SYSTEM has such a large memory usage:
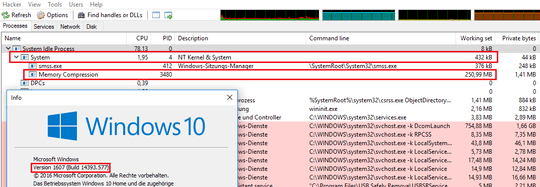
But it looks like Taskmgr doesn't show this process, only ProcessExplorer/ProcessHacker are able to show it. The Taskmgr only shows the amount of compressed memory in the overview:
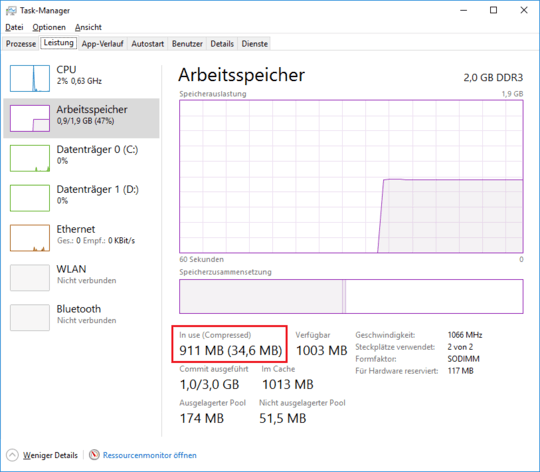
If you hover over the used memory graph in Taskmgr you see a tooltip that shows the amout of data that are compressed.
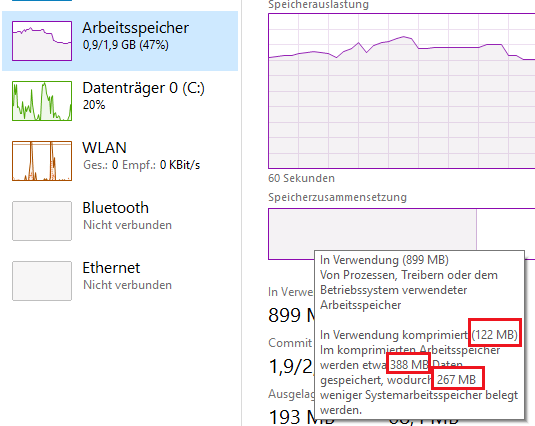
In this demo 388MB are compressed to 122MB so 267MB are saved with the compression.



1ok, I added the information that was able to find. Check them – magicandre1981 – 2015-08-18T19:39:49.200
1This is a feature of the system to actually keep more things in RAM by using compression instead of paging to disk. @magicandre1981 has the right info here which should be accepted as the right answer. – Mani Gandham – 2015-11-08T07:33:09.067
The 14 megabytes that poolmon shows is associated with the smNp tag is a purely trivial amount. You're worried about 1.3 GB in the System process private working set - why focus on 14 MB of nonpaged pool (which isn't in any process's working set, at all)? – Jamie Hanrahan – 2017-03-20T09:26:43.467