5
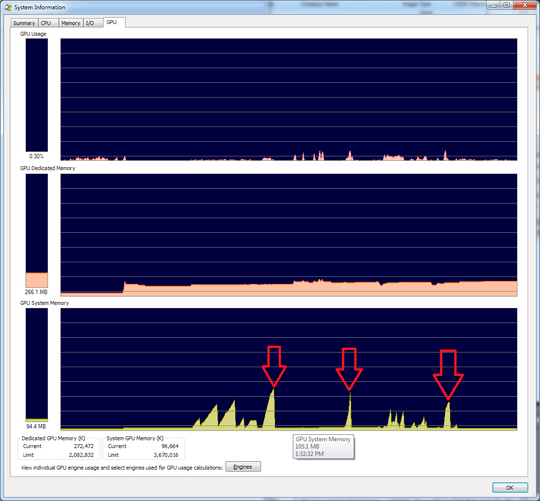
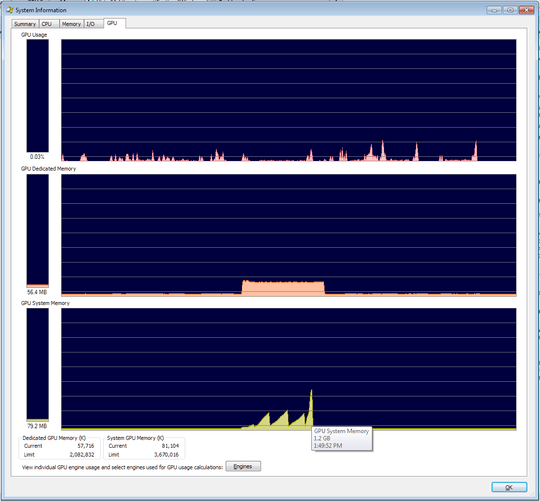
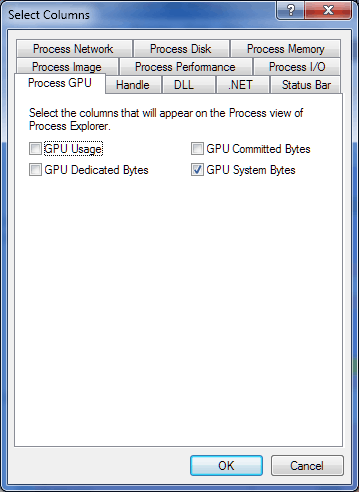
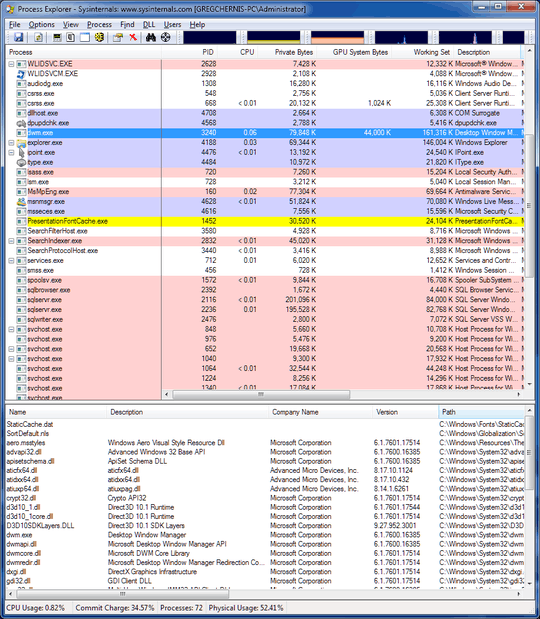
I am trying to figure out which app in my system is responsible for the memory spikes (note that the spikes are seen on GPU tab).
Here's a question that spawned this one.
EDIT To show System Information graphs in Process Explorer, try clicking on any of the graphs at the top of main ProcessExplorer window.

GregC
Posted 2012-04-29T18:46:11.053
Reputation: 444

I would approach the problem by ignoring it. Memory use is normal -- that's what memory is for. – David Schwartz – 2012-04-29T19:01:55.007
I saw the linked question. I don't get the link. Are you experiencing poor performance? If so, why not ask about troubleshooting it? – David Schwartz – 2012-04-29T19:38:52.357
You really haven't, I'm afraid. For example, without knowing whether the memory spikes correlate with the error messages, or whether the memory spikes correlate with poor performance (or, for that matter, whether you're problem is poor performance or just the cosmetic problem of an annoying error message), you're not likely to get useful help with your problem. You've hidden from us all the information about what the problem actually is. – David Schwartz – 2012-04-29T19:50:21.950
@DavidSchwartz The possibility of poor performance has been cleverly circumvented by Microsoft engineers. They simply disable Aero, freeing all the memory resources that were snapped up by it. End-points of the spikes correlate to auto-disabling of Aero. I was stubborn and re-enabled it again and again, causing multiple such spikes. – GregC – 2012-04-29T19:53:36.007
How did u launch that window. Is it a native monitoring tool in Windows? I just asking because I'm not sure how to launch it. – rubixibuc – 2012-04-30T03:37:21.823