Too much memory getting used

13

4

I have been feeling this way for a while, looking at task manager mentally ballparking how much physical memory should be in use, and noticing a large disparity. I finally got around to measuring it. Taking the results of tasklist and adding, gave about 3.87 GB. Task manager told me I was using 4.6 GB of memory. This seems like a large disparity. Where did it go?

EDIT: So its clear, it is not going to prefetch. It has also been suggested that its part of the OS, but not part of any of the system processes. If this is true, please find a way to get the OS to tell me how much memory is getting used. Since I want to find out where the memory went, asking me to look at the difference does nothing for me.

EDIT 2: It is not the following:

  1. The kernel
  2. The cache
  3. Hardware reserved memory

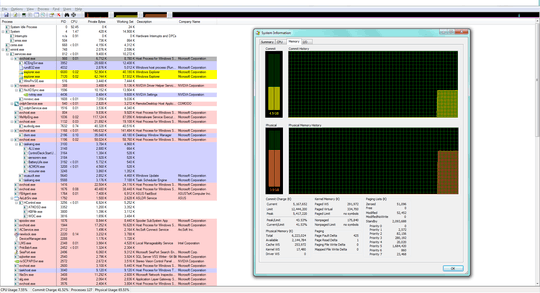
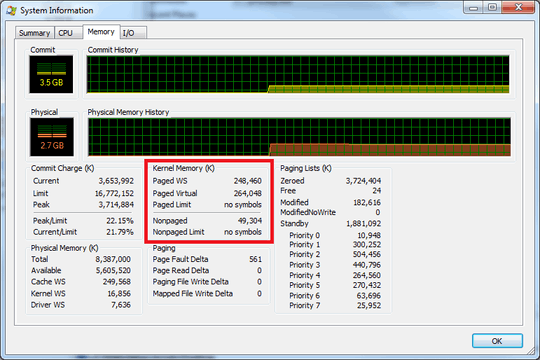
Picture of resources taken up. Not quite sure what it will do but... enter image description here

soandos

Posted 2011-06-03T01:42:37.980

Reputation: 22 744

What OS are you using? You'll get better answers with more information :) – Cam Jackson – 2011-06-03T01:46:29.997

Apologies see new tag :) – soandos – 2011-06-03T01:47:17.227

@soandos: Have you tried disabling superfetch and rebooting? Does it make a difference? – user541686 – 2011-06-06T02:30:47.723

Yes I did and no it didn't, though it would also be nice to know how much memory prefetch takes up. – soandos – 2011-06-06T02:31:09.380

Post the numbers of total memory, cached, available and free. – Hello71 – 2011-06-06T02:33:18.533

Total = 6077, Cached = 1900, Available = 2152, Free = 155 (ish) – soandos – 2011-06-06T02:36:07.787

Related - Windows 7 memory usage

– Sathyajith Bhat – 2011-06-06T04:38:18.690

Forgot to mention, I am on 64-bit Windows – soandos – 2011-06-06T04:52:23.603

Weird things are happening! It must be a virus! Format your computer! – Mateen Ulhaq – 2011-06-06T05:27:56.553

@muntoo I can't tell if you are joking, but not funny. – soandos – 2011-06-06T05:55:18.473

If you want more detailed memory information, grab a program called Process Explorer (from Microsoft / Sysinternals), Tell it to show processes for all users (under the file menu), and then bring up the memory/cpu information with Ctrl+I. A screenshot of that might help diagnose where the memory discrepancies are coming from. I know that my desktop at home often pulls over 500MB of memory for the kernel alone (Kernel Paged WS + Nonpaged), which would show up as memory with no entry in the task list but still used. – Darth Android – 2011-06-09T15:32:30.587

Already done, and with that program and others. – soandos – 2011-06-09T16:51:34.157

2Prefetch does NOT use memory, it caches the most used bytecode from compiled applications. Do not disable it or your system performance will fall drastically. – Breakthrough – 2011-06-10T01:49:15.313

@Breakthrough I did not, except to test the proposition. Thank you though. – soandos – 2011-06-10T02:21:15.860

Can I ask... what's the problem here? If you're not actually seeing any performance issues as a result of Windows using the RAM you've given it, why do you care? Is it just curiosity? – Django Reinhardt – 2011-06-10T18:37:49.000

Basically, I want to know why I get all these different numbers, so yes, it is curiosity. – soandos – 2011-06-11T18:01:11.943

You may want to consider using Cacheman to determine how much true "free" memory you have. IIRC, you can get a free trial off of their website (unfortunately it is not a free program...). – Breakthrough – 2011-06-12T15:16:51.890

Answers

5

I suggest downloading the Sysinternals Suite from Microsoft. It includes several utilities that will give you more information than Task Manager does. Take a look at the Process Explorer, RAMMap, VMMap, and Process Monitor utilities. To get the most information from them, you may need to do some configuration to change what info is displayed.

Also, since you're interested in Windows memory, here is a series of blog posts from Mark Russinovich, one of the Sysinternals developer/founder. It will help make sense of the info the utilities provide.

Joe Internet

Posted 2011-06-03T01:42:37.980

Reputation: 5 145

This "answer", even though accepted, does not answer the question! It merely suggests tools and reading for investigation. – Jamie Hanrahan – 2018-09-27T23:41:20.187

RAMMap seems to be telling me that task manager is overstating the total ram usage by about 100MB, but according to the list of memory that I can pull using tasklist, RAMMap is also overstating by about 200MB (tasklist +200 = RAMMap, RAMMap + 100 = taskmanger) – soandos – 2011-06-06T14:06:36.107

1I'm not sure of what you're seeing, and I'm not on a Windows machine atm to look into it. However, if you still want to dig deeper, ask on the Sysinternals forums. There are some very smart people there that are very "into" Windows internals. They'll be more familiar with the finer points of Windows memory management. – Joe Internet – 2011-06-06T18:25:57.027

For future reference, here's Mark Russinovich's TechEd 2011 talks on Windows memory management: http://channel9.msdn.com/Events/TechEd/NorthAmerica/2011?sort=sequential&direction=desc&term=&s=Mark%2BRussinovich&l=400+-+Expert#tab_sortBy_day

– Joe Internet – 2011-06-13T02:22:12.857

8

Windows 7 uses 'unused' memory to precache things to make things run faster. Should you need this memory, it'll get freed up.

Its a feature, not a bug ;)

From technet

After you’ve used a Windows Vista system a while, you’ll see a low number for the Free Physical Memory counter on Task Manager’s Performance page. That’s because SuperFetch and standard Windows caching make use of all available physical memory to cache disk data. For example, when you first boot, if you immediately run Task Manager you should notice the Free Memory value decreasing as Cached Memory number rises. Or, if you run a memory-hungry program and then exit it (any of the freeware “RAM optimizers” that allocate large amounts of memory and then release the memory will work), or just copy a very large file, the Free number will rise and the Physical Memory Usage graph will drop as the system reclaims the deallocated memory. Over time, however, SuperFetch repopulates the cache with the data that was forced out of memory, so the Cached number will rise and the Free number will decline.

Journeyman Geek

Posted 2011-06-03T01:42:37.980

Reputation: 119 122

Memory used by Superfetch is on the Standby page list and is counted as part of "Available". It's not counted as "in use" because it can be repurposed (yanked out of the Standby list and put into a process) just like everything else on the Standby list, and everything on the Free and Zero list too. – Jamie Hanrahan – 2018-09-27T23:39:45.897

1>

  • so why is that not listed under the memory for that process?
  • how do I know that is the case here?
  • < – soandos – 2011-06-03T01:59:20.217

    i believe superfetch is under svchost. It MIGHT be counted as kernel memory. You can try turning superfetch on and off to check. – Journeyman Geek – 2011-06-03T02:05:14.357

    It did nothing. – soandos – 2011-06-03T02:09:14.863

    5

    The numbers you see are totally imprecise and should only be taken as indications.

    An operating system is an extremely complex entity and a simple-minded program like Task Manager can never total the entire usage, many parts of it are simply inaccessible in User mode under which it runs. Some of the elements that are inaccessible to it, or are simply impossible to attribute to any "task", are the hardware segmentation tables, shared-memory allocations, kernel-allocated memory, page-memory allocations, device-memory and many more.

    You will find more explanations in How do I interpret the Performance tab of Task Manager?, but I choose to quote this part :

    What do you expect from a program calling itself the "Task Manager" anyway? There is nothing called a "task" in the operating system kernel - the OS has "processes" and "threads". DOS had "tasks". The Intel hardware has "task" structures, but the OS doesn't use them because it's faster for it to do it itself.

    The Task Manager is a very old Windows program, has problems even attributing functions to services, and the numbers it shows should be taken with a large pinch of salt. It is probably missing out on large areas of memory that it cannot manage to count or attribute to any "task".

    harrymc

    Posted 2011-06-03T01:42:37.980

    Reputation: 306 093

    The notion that Task Manager is a "very old Windows program" is silly. It's updated with every version of the OS just like just about everything else. As for "the only numbers you can get", haven't you used Performance Monitor? – Jamie Hanrahan – 2018-09-27T23:37:22.993

    @JamieHanrahan: Yes Windows is updated all the time, but not this answer. Did you notice that this answer dates from 2011? – harrymc – 2018-09-28T07:54:53.040

    Yes. The point I addressed is still mistaken. Task Manager is no more subject to e.g. "missing out on large areas of memory that it cannot manage to count" than anything else that shipped with, in this case, Windows 7. fwiw, Task Manager, Performance Monitor, and Resource Monitor get almost all of their data via the same methods. Which use APIs that, where necessary, call into kernel mode and get their info from kernel space. otoh, RAMmap does use some special kernel mode interfaces of MarkR's own design, so it can indeed show other info. – Jamie Hanrahan – 2018-09-28T08:01:53.910

    So what program should I use to figure it out? PS Task mangager does have the kernel memory listed. – soandos – 2011-06-06T13:57:02.600

    1

    There is no one program that will give you ALL the information. Task Manager will give some info and an approximation, Device Manager can tell about device-memory, WinObj about memory objects. The best source is the Resource Monitor, called from the Performance tab of Task Manager (and elsewhere), which is actually the modern replacement of Task Manager.

    – harrymc – 2011-06-06T14:05:06.997

    Resource manager gives a number within 15 of Task manager. – soandos – 2011-06-06T18:47:00.670

    These look like the only numbers that you can get from the Windows interface. They are not precise, but are much better than nothing. They can be used for troubleshooting (which I do a lot), but don't expect them to include everything. – harrymc – 2011-06-06T19:44:21.140

    3

    As you may have noticed, Task Manager can give you a simplified snapshot of how most applications are affecting your system, but leaves a lot to be desired. If you really want to dig into caches in RAM etc. you need to get into Performance Monitor. It will take some work for you to build your set of system counters to monitor your system.

    You can get there by running compmgmt.msc or a windows search for "computer management" and on the left-hand side, you will see a performance tree that you can expand and dig into.

    Here is a reference for some of the tools available: http://technet.microsoft.com/en-us/library/cc749249.aspx

    Dustin G.

    Posted 2011-06-03T01:42:37.980

    Reputation: 2 025

    While I see that its a very cool tool, that can do a lot of things (as evidenced by the fact that there a ton of counters under memory, I have zero idea what I am looking for. Any ideas? – soandos – 2011-06-06T06:06:45.423

    In addition, the add counter option tends to stick to my screen, and I have to manually change the resolution back and forth to fix it (refresh does not work). Not your fault I know. – soandos – 2011-06-06T06:08:37.653

    3

    The memory is probably being used for the kernel. Using Process Explorer we can see a much more detailed breakdown of system memory:

    Kernel Memory Information

    Here I've highlighted the amount of memory in use by the kernel, which is Paged WS + Nonpaged, or roughly ~300MB of memory. This is on a freshly started system with just webbrowser and a few other applications open, though under heavy load my home system easily breaks 500MB or even 700MB of kernel memory.

    Darth Android

    Posted 2011-06-03T01:42:37.980

    Reputation: 35 133

    I looked at that, and that does not give enough. Thank you though. – soandos – 2011-06-09T16:50:33.217

    Are you asking about the difference between the Commit and the Physical Memory numbers? – Darth Android – 2011-06-10T18:51:42.680

    No, I am asking why when I run different tools that are supposed to get me the same numbers, I get different numbers. – soandos – 2011-06-11T18:03:25.840

    2

    @soandos, did you take into account how much memory the video is pulling? It is very possible that the video is pulling .73 GB of RAM. Do you have a decent video card on this machine? If not, it will use RAM like this (as of what I know). If I am wrong, someone please chime in here, but I believe that this could be the effect of the video pulling from the RAM.

    David

    Posted 2011-06-03T01:42:37.980

    Reputation: 6 975

    I have an Nvidia GTS 360M. It is not a great video card, but it does have a GB of memory. – soandos – 2011-06-08T17:59:51.057

    What type of monitor are you using with which resolution are you using? Also, are you doing video intensive tasks, like playing games at 1080p? And what type of RAM does you video card use(e.g. DDR1, DDR2, DDR3, DDR5)? I would look it up myself, but I tried that with someone's video card model and noticed that they made it with a few different types of RAM... – David – 2011-06-08T18:03:40.967

    Standard with the computer, 1920x1080, no idea. Is there a way to just measure this? – soandos – 2011-06-08T18:06:30.413

    Normally it will say on the packaging, I'm not sure. If you know that exact card model, you can find out on the internet. If it isn't a very powerful video card (using DDR2, DDR1) and you are using 1920x1080 with a big monitor (for instance, I am using a Samsung 46" TOC TV as my monitor at home), you can burn up a lot of memory just on video... I'm not sure if there is a way to see how much RAM your video is consuming. I will do some research on it right now though. I will comment back whether or not I find anything. I want to help you out as much as possible. – David – 2011-06-08T18:21:06.117

    I am currently checking out this program to see if it might have what we are looking for. It is SiSoftware Sandra Lite 2011.2.17.47. The description states that it does what we are looking for, such as how much RAM the video is consuming.

    – David – 2011-06-08T18:43:00.730

    @soandos, you might want to try this program out for youself, I cannot get it to work correctly on my computer for the GPU ratings. I can only get it to test anything else. I think it is because of some things I have done to my computer in the past (taking the hard drive out and putting it in another computer and forcing it to work correctly.) Let me know if it helps you out. – David – 2011-06-08T18:53:02.240

    I downloaded the program, and I don't see a way to get the number. I did find that it is DDR2 RAM though. – soandos – 2011-06-08T19:40:52.007

    Technically, a well written graphics card driver will allow the OS to map MOST of its device's memory to the upper boundaries. Usually there are exceptions and they'll leave a stub and a couple of legacy functions under the 4GB limit. A better way to find out how much memory it is mapping is to go under Device Manager and look under to I/O resources. It will show the address ranges (hexadecimal). – surfasb – 2011-07-01T00:34:44.410

    1

    The difference I think you're seeing is not because the tools not being able to see the used memory, rather it's because of different forms of measurement. I can't explain this very well but fortunately I don't have to, Mark Russinovich of Sysinternals fame has written a very good series of posts regarding process performance in Windows. The parts about physical memory and virtual memory should explain what you're seeing.

    Paxxi

    Posted 2011-06-03T01:42:37.980

    Reputation: 6 952

    No, that is not the issue. I am more concerned with the total amount than where it is stored (RAM or HD). – soandos – 2011-06-11T17:58:47.887

    0

    I think I solved it!

    I just came across a tip about RAMMap and it turned out it's µTorrent!

    Not utorrent.exe itself, but files shared by µTorrent – at least in my case: one of the files was using over 600 MB, and another over 200 MB, etc.

    user184804

    Posted 2011-06-03T01:42:37.980

    Reputation: 1

    -1

    Some memory is used as cache. As soon as you need this memory, it is automatically released. So, no need to worry.

    Neel Mehta

    Posted 2011-06-03T01:42:37.980

    Reputation: 271

    -1 It is not the cache as that is 1) counted separably, 2) easily accounted for. – soandos – 2011-06-08T19:39:56.407