Triangular Ulam spiral

21

3

We've had a couple of challenges about the Ulam spiral. But that's not enough.

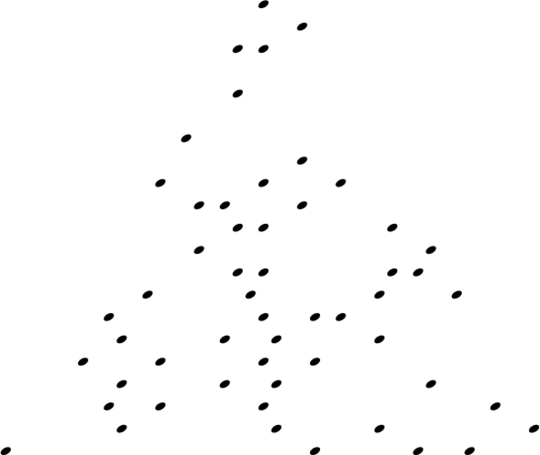
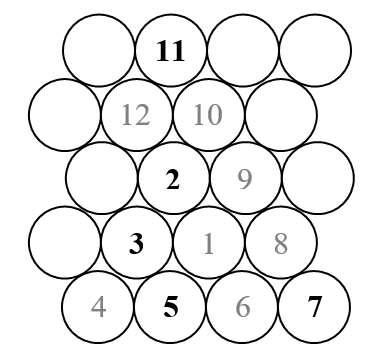
In this challenge we will plot a triangular Ulam spiral (as opposed to the usual, square Ulam spiral). Here's a sketch of what the spiral looks like.

enter image description here

As we know, the Ulam spiral arranges all natural numbers in an outward spiral, and marks only those that are prime. So in the above sketch only the numbers that appear in black (the primes) would be shown.

The challenge

Accept a number N as input and display the triangular Ulam spiral up to that number.

  • Input can be stdin or function argument.
  • The spiral should turn in the positive direction (that is, counter-clockwise), as in the above figure.
  • Any of the 120-degree turns of the above figure would be valid, and the turn may be different for different inputs. But the lowest side of the implied triangles should be horizontal, as the only allowed turns are (multiples of) 120 degrees.
  • The code should run theoretically (given enough time and memory) for any N up to what is allowed by any intermediate calculations you do with your default data type. double is enough; no need for large integer types.
  • All built-in functions allowed.
  • I won't accept my own answer (not that I think it would be the shortest anyway...).

Output formats

Choose any of the following.

  1. Display a graph with a marker (dot, circle, cross, whatever you prefer) at prime numbers, and nothing at non-prime numbers. Scale need not be the same for the two axes. That is, the implied triangles need not be equilateral. Axes, grid lines and axis labels are optional. Only the markers at the prime numbers are required.

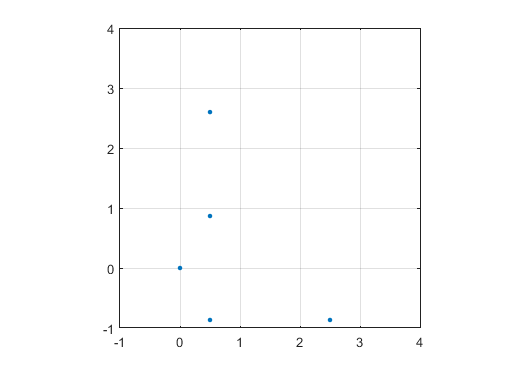
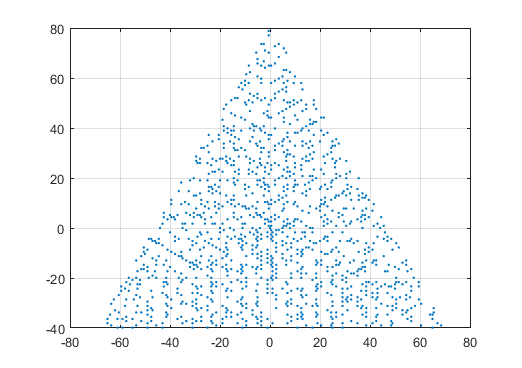
    An example output for N = 12 would be as follows (compare with the above sketch). The second plot is a more interesting example, corresponding to N = 10000.

enter image description here

enter image description here

  1. Produce an image file with the above, in any well known image format (such as png, tiff, bmp).
  2. Display the spiral as ASCII art, using a single character of your choice for primes and blank space for non-primes, with a blank space to separate number positions in the same row. Leading or trailing spaces or newlines are allowed. For example, the N = 12 case using o as character would be

                 o
                · ·
               · o ·
                o · ·
               · o · o
    

    where of course only the o mark at primes would actually be displayed. The · at non-primes is shown here for reference only.

Winning criterion

The actual reward is seeing for yourself those amazing patterns Code golf, shortest code wins.
Luis Mendo

Posted 2016-01-15T11:15:06.947

Reputation: 87 464

2In the future I'd recommend choosing only one of [graphical-output] and [ascii-art] as it makes the submissions less comparable. But nice challenge anyway. :) – Alex A. – 2016-01-15T20:09:21.710

@AlexA. Thanks! I'll take that into account. So... will there be a Julia answer? ;-) – Luis Mendo – 2016-01-15T20:13:15.967

Wow, thanks for the bounty, but you should accept your own answer. It is the shortest. :) – Martin Ender – 2016-01-28T12:23:35.043

It is well deserved! As for accepting an answer, one of the challenge rules was "I won't accept my own answer". When I thought this challenge I inevitably had MATL in mind, with its complex-number and graphical functions, so it was a bit like cheating :-) – Luis Mendo – 2016-01-28T12:48:57.327

Answers

13

CJam, 49 42 bytes

Lri{)mp0S?}%{1$,)/(a@Wf%z+\L*}h;eeSff*W%N*

Input as a single integer in STDIN. Output as an ASCII grid with 0 for primes. The rotation of the spiral is not consistent: the largest number of the spiral will always be on the bottom row.

Test it here.

Explanation

The basic idea is to represent the triangle as a ragged 2D array while doing the computation. You get this array by reversing the lines and aligning all rows to the left:

   4
  5 3
 6 1 2
7 8 9 A

Would be represented as

[[7 8 9 A]
 [6 1 2]
 [5 3]
 [4]]

Since we've mirrored the line, we want to roll up the spiral in a clockwise manner. That's convenient, because all we need to do is rotate the triangle counter-clockwise and prepend the next sublist in order. We can rotate the ragged array by reversing all lines and transposing it:

                                                           [[B C D E F]
[[7 8 9 A]         [[A 9 8 7]           [[A 2 3 4]          [A 2 3 4]
 [6 1 2]   reverse  [2 1 6]   transpose  [9 1 5]   prepend  [9 1 5]
 [5 3]      ---->   [3 5]      ------>   [8 6]      ---->   [8 6]
 [4]]               [4]]                 [7]]               [7]]

So here is the code. One detail I'd like to draw attention to is the last bit that creates the triangular layout. I think that's rather nifty. :)

L     e# Push an empty array. This will become the spiral.
ri    e# Read input and convert to integer N.
{     e# Map this block over 0 to N-1...
  )   e#   Increment to get 1 to N.
  mp  e#   Test for primality.
  0S? e#   Select 0 or a space correspondingly.
}%
{     e# While the list we just created is not empty yet...
  1$  e#   Copy the spiral so far.
  ,)  e#   Get the number of lines and increment.
  /   e#   Split the list into chunks of that size.
  (a@ e#   Pull off the first chunk, wrap it in an array, pull up the spiral.
  Wf% e#   Reverse the lines of the spiral.
  z   e#   Transpose the spiral.
  +   e#   Prepend the new line.
  \L* e#   Swap with the remaining chunks and join them back together into a single list.
}h
;     e# Discard the empty list that's left on the stack.
ee    e# Enumerate the spiral. This turns each line into a pair of 0-based index
      e# and the line itself.
Sff*  e# Multiply each element of each pair with a space. For the enumeration index i,
      e# this produces a string of i spaces - the required indentation (keeping in
      e# mind that our spiral is still upside down). For the line itself, this
      e# riffles the cells with spaces, creating the required gaps between the cells.
      e# All of this works because we always end the spiral on the bottom edge.
      e# This ensures that the left edge is always complete, so we don't need
      e# different indentation such as in the N=12 example in the challenge.
W%    e# Reverse the lines to make the spiral point upwards.
N*    e# Join the lines with linefeeds.

Martin Ender

Posted 2016-01-15T11:15:06.947

Reputation: 184 808

1I knew you'd be the first! – Luis Mendo – 2016-01-15T12:58:45.223

@LuisMendo I was actually going to skip this one, because I thought the computation of the grid indices would be tedious, but then I realised I could just rotate the entire triangle while appending lines. – Martin Ender – 2016-01-15T13:10:00.793

1I always love your explanations of CJam programs because I can understand them, and I'm amazed at how complex, yet short, these programs can be. – ETHproductions – 2016-01-15T15:08:04.037

10

MATL, 48 36 bytes

:1-H*X^.5+Y[2j3/*YP*ZeYsG:Zp)'.'2$XG

Uses current release (9.3.0).

Try it online! No idea how the online compiler manages to translate graphic output to ASCII, but it does This produces an approximate ASCII plot thanks to an Octave feature that is supported by the online compiler!

Edit (April 4, 2016): the function Y[ has been renamed to k since release 13.0.0. The link to the online compiler incorporates this change, so that the code can be tested.

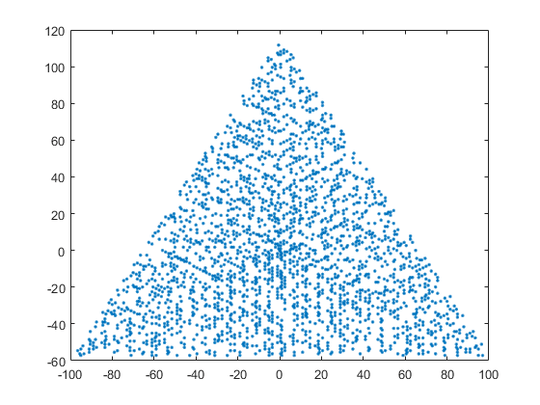
Example

>> matl
 > :1-H*X^.5+Y[2j3/*YP*ZeYsG:Zp)'.'2$XG
 > 
> 20000

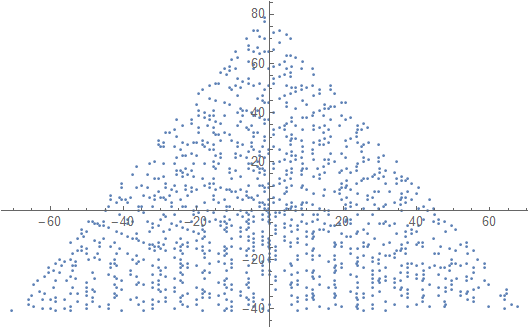
produces the graphical output (MATLAB version shown):

enter image description here

Explanation

The code uses complex numbers to trace the path followed by the spiral. As can be seen from the first figure in the challenge, each straight leg of the spiral is a segment with increasing length 1, 2, 3, 4 ... and cyclically increasing orientation 120 degrees, 240 degrees, 0 degress, 120 degress...

The code first generates the individual complex displacements from each integer number to the next. These complex displacements have magnitude 1 and angle 2*pi/3, 4*pi/3 or 0 (in radians). Thus they can be easily generated as imaginary exponentials. For that, the integer sequence 0,1,2,2,3,3,3,4,4,4,4... is used first.

This integer sequence is almost like the "n appears n times" sequence (OEIS A002024), and can be obtained as floor(sqrt(2*n)+.5) where n is 0,1,2,3,... . Multiplying by 2j*pi/3, where j is the imaginary unit, produces the desired complex displacements.

The displacements are accumulated to compute the positions corresponding to the integer numbers in the spiral. The first integer number in the spiral, which is 1, is arbitrarily located at position 1 in the complex plane.

Finally, the positions corresponding to non-prime numbers are discarded, and the rest are plotted in the complex plane.

:1-H*X^.5+Y[     % floor(sqrt(2*n)+.5) for n from 0 to N-1, where N is implicit input
2j3/*YP*Ze       % exp(2j*pi/3* ... )
Ys               % cumulative sum. Produces complex positions
G:               % vector 1,2...,N, where N is previous input
Zp               % logical index to select only prime numbers
)                % use that index to keep only complex positions of primes
'.'2$XG          % plot using marker '.'

Luis Mendo

Posted 2016-01-15T11:15:06.947

Reputation: 87 464

What O.o I need to read this further – Brain Guider – 2016-01-15T18:45:46.600

Does Try It Online! support graphical output for MATL? – Alex A. – 2016-01-15T20:20:20.123

I thought TIO didn't support graphical output? If it does, I can easily have MATL automatically dump images to a .png file to be shown by the web page @AlexA – Luis Mendo – 2016-01-15T20:22:53.487

Hey! I did I simple test (plot(1:5)) and it does produce text-graphic output!! http://matl.tryitonline.net/#code=NTpYRw&input= @AlexA. How's this??

– Luis Mendo – 2016-01-15T20:23:45.373

4WHOA! That's awesome! – Alex A. – 2016-01-15T20:24:12.063

This seems to be the explanation: with Octave you get ASCII plots if there's no graphic display http://stackoverflow.com/questions/13745987/character-mode-shell-plots-with-matlab-octave/13747962#13747962

– Luis Mendo – 2016-01-15T20:42:23.883

8

Drawing should be done with

LaTeX / PGF, 527 594 bytes

\documentclass{standalone}\usepackage{pgf}\let\z\let\z\e\advance\z\f\ifnum\z\h\the\z\a\newcount\a\i\a\j\a\l\a\x\a\y\a\p\a\q\a\n\i=1\l=1\p=-1\q=1\def\m#1{\e\i by1\e\j by1\e\x by\h\p\e\y by\h\q\pgfmathparse{isprime(\h\i)}\f\pgfmathresult=1\pgfpathcircle{\pgfpoint{\h\x cm}{\h\y cm}}3pt\fi\f\j=\l\e\l by1\j=0\f\p=1\p=-1\q=1\else\f\p=-1\p=0\q=-1\else\p=1\q=0\fi\fi\fi\f#1>0\e#1by-1\m#1\fi}\begin{document}\begin{pgfpicture}\pgftransformcm10{cos(60)}{sin(60)}\pgfpointorigin\n=4000\m\n\pgfusepath{fill}\end{pgfpicture}\end{document}

527 bytes is the full document as above, i.e. including preamble and parameter (here 4000, so ~523 without parameter). Produces a PDF file.

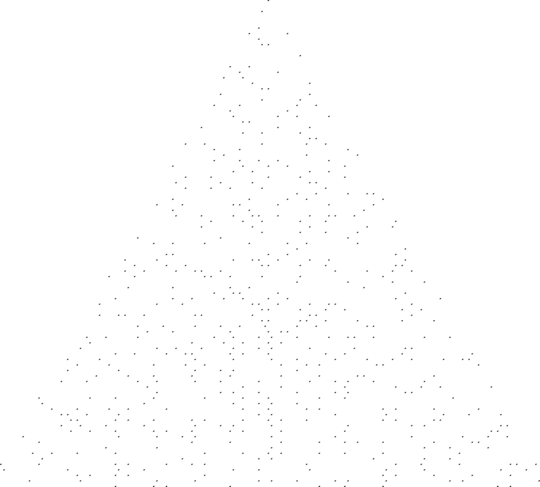
Basic idea: well, just draw. Uses a matrix transformation for a triangular grid. Only problem is that also the dots are affected (and stretched) out by the transformation. So I choose for ellipse markers :) what I mean by that is clear in the second image (n=250, 5pt).

Another caveat: can only handle up to a bit less than 5000 because of TeX's maximum stack size. The first image is for n=4000. Apparently it is possible to increase the stack size, I didn't try it.

Uses PGF's isprime().

enter image description here

enter image description here

Ungolfed:

\documentclass[border=10cm]{standalone}

\usepackage{pgf}

\newcount\ulami
\newcount\ulamj
\newcount\ulamlen

\newcount\ulamx
\newcount\ulamy
\newcount\ulamdx
\newcount\ulamdy

\ulami=1 %
\ulamj=0 %
\ulamlen=1 %
\ulamdx=-1 %
\ulamdy=1 %
\ulamx=0 %
\ulamy=0 %

\def\ulamplot#1{%
  \advance\ulami by 1 %
  \advance\ulamj by 1 %

  \advance\ulamx by \the\ulamdx %
  \advance\ulamy by \the\ulamdy %

  \pgfpathmoveto{\pgfpoint{\the\ulamx cm}{\the\ulamy cm}}

  \pgfmathparse{isprime(\the\ulami)}
  \let\r=\pgfmathresult
  \ifnum\r=1
    \pgfpathcircle{\pgfpoint{\the\ulamx cm}{\the\ulamy cm}}{5pt}
  \fi

  \ifnum\ulamj=\the\ulamlen %
    \advance\ulamlen by 1 %
    \ulamj=0 %
    \ifnum\ulamdx=1 %
      \ulamdx=-1 %
      \ulamdy=1 %
    \else%
      \ifnum\ulamdx=-1 %
        \ulamdx=0 %
        \ulamdy=-1 %
      \else%
        \ulamdx=1 %
        \ulamdy=0 %
      \fi
    \fi
  \fi

  \ifnum#1>0 %
    \advance#1 by -1 %
    \ulamplot{#1}%
  \fi
}

\begin{document}

\begin{pgfpicture}
  \pgfmathsetmacro{\x}{cos(60)}
  \pgfmathsetmacro{\y}{sin(60)}
  \pgftransformcm{1}{0}{\x}{\y}{\pgfpointorigin}

  \pgfpathmoveto{\pgfpointorigin}
  \color{blue}
  \newcount\ulamn
  \ulamn=400
  \ulamplot{\ulamn}
  \pgfusepath{stroke,fill}
\end{pgfpicture}

\end{document}

user42682

Posted 2016-01-15T11:15:06.947

Reputation:

1Wow. It would have never occurred to me to do this in LaTeX – Luis Mendo – 2016-01-25T23:18:15.503

Using lualatex or some other dynamically allocating compiler should let you bypass the stack size, if I understand your corresponding comment correctly. So it's not a limitation of your answer, just of most of the implementations where you'd run it. – Andras Deak – 2016-01-25T23:29:35.583

Sorry, I've checked and the input stack size limit is unrelated to memory allocation which I addressed in my previous comment:( – Andras Deak – 2016-01-26T00:04:49.313

@AndrasDeak that's okay, thanks for looking it up. I found a method that apparently does increase the stack size, but didn't try it myself (yet).

– None – 2016-01-26T07:50:17.240

@CamilStaps thanks, I've found other similar posts, but I didn't try them either. Anyway, I take Christian Feuersänger's posts as canon:) – Andras Deak – 2016-01-26T12:29:29.163

2

Mathematica, 94 bytes

ListPlot@Accumulate[Join@@Table[ReIm@Exp[2i Pi/3I],{i,2#^.5},{i}]][[Prime@Range@PrimePi@#-1]]&

Result

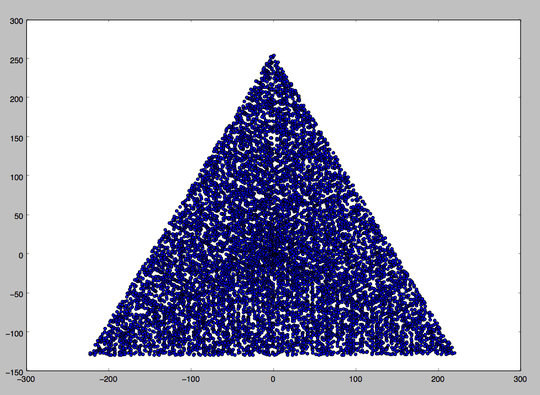
%[10000]

enter image description here

njpipeorgan

Posted 2016-01-15T11:15:06.947

Reputation: 2 992

2

Python, 263 bytes

Being new to Python, there is surely room for improvement :)

from matplotlib.pyplot import*
from math import*
def f(m):
 s=[];X=[];Y=[];i=x=y=0
 while len(s)<m:i+=1;s+=[i%3*pi*2/3]*i
 for i in range(m):
  x+=cos(s[i]);y+=sin(s[i]);j=i+2
  if all(map(lambda a:j%a>=1,range(2,int(j**.5+1)))):X+=[x];Y+=[y]
 scatter(X,Y);show()

Example:

f(100000)

enter image description here

lambruscoAcido

Posted 2016-01-15T11:15:06.947

Reputation: 401

You can shorten s=[];X=[];Y=[];i=1;x=0;y=0 to s=X=Y=[];i=1;x=y=0; – rp.beltran – 2016-01-26T23:42:18.530

Ignore that extra semicolon at the end. It should spare you 8 bytes. – rp.beltran – 2016-01-26T23:50:16.043

@rp.beltran. This does not work. I think it is related to the fact the objects share the same values. Could only add x=y=0. – lambruscoAcido – 2016-01-27T08:47:12.713

My bad, you are right. I forgot that Python passes lists by reference. Numbers are immutable and so it is safe to do with integers. – rp.beltran – 2016-01-28T02:21:45.117

1

R, 137 bytes

Uses only built-in functions, even for prime numbers. Given its vectorized approach instead of iterative, it is fast, but cannot handle huge numbers.

Golfed:

g=function(m){M=1:m;s=rep(M,M)[M]%%3*pi*2/3;k=cumsum;j=sapply(seq(s)+1,function(n)n<4|all(n%%2:n^.5>=1));plot(k(cos(s))[j],k(sin(s))[j])}

Ungolfed:

g=function(m) {
  M = 1:m
  s = rep(M,M)[M] %% 3 * pi * 2/3
  k=cumsum
  j=sapply(seq(s)+1,function(n)n<4|all(n%%2:n^.5>=1)) # primes
  plot(k(cos(s))[j],k(sin(s))[j])    # cumulated coordinates
}

Example:

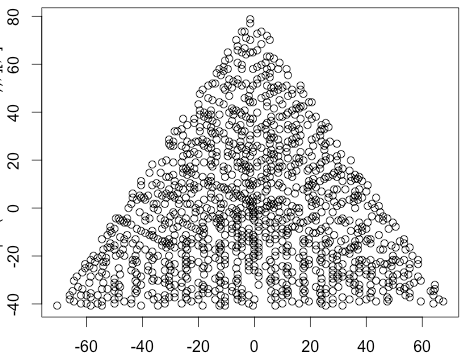
g(10000)

enter image description here

lambruscoAcido

Posted 2016-01-15T11:15:06.947

Reputation: 401

Can you add an example result? – Luis Mendo – 2016-01-26T21:57:27.587

@LuisMendo. Sure. I had only to figure out how to add a plot. – lambruscoAcido – 2016-01-26T22:00:39.853