Who's that probability distribution?

16

2

Introduction

In this challenge, you are given a list of nonnegative floating point numbers drawn independently from some probability distribution. Your task is to infer that distribution from the numbers. To make the challenge feasible, you only have five distributions to choose from.

Note that all of the above distributions have mean exactly 1/2.

The Task

Your input is an array of nonnegative floating point numbers, of length between 75 and 100 inclusive. Your output shall be one of the letters UTBEG, based on which of the above distributions you guess the numbers are drawn from.

Rules and Scoring

You can give either a full program or a function. Standard loopholes are disallowed.

In this repository, there are five text files, one for each distribution, each exactly 100 lines long. Each line contains a comma-delimited list of 75 to 100 floats drawn independently from the distribution and truncated to 7 digits after the decimal point. You can modify the delimiters to match your language's native array format. To qualify as an answer, your program should correctly classify at least 50 lists from each file. The score of a valid answer is byte count + total number of misclassified lists. The lowest score wins.
Zgarb

Posted 2015-11-03T16:52:33.897

Reputation: 39 083

I probably should have asked earlier, but how much optimization towards the test cases is expected? I'm at a point where I can improve my score by tweaking a few parameters, but the impact on the score will probably depend on the given test cases. – Dennis – 2015-11-03T19:38:16.323

2@Dennis You can optimize as much as you want, the test cases are a fixed part of the challenge. – Zgarb – 2015-11-03T19:55:22.650

Y U NO Student-t distribution? =( – N3buchadnezzar – 2015-11-29T10:30:59.930

Answers

6

Julia, 60 62 bytes + 25 2 errors = 82 64

k->"EGTBU"[(V=std(k);any(k.>1)?V>.34?1:2:V<.236?3:V>.315?4:5)]

This is fairly simple. The variance for the distributions are mostly different - it's 1/4 for exponential, 1/8 for beta, 1/12 for gamma and uniform, and 1/24 for triangular. As such, if we use variance (here done using std for standard deviation, the square root of variance) to determine the likely distribution, we only need to do more to distinguish gamma from uniform; for that, we look for a value larger than 1 (using any(k.>1)) - that said, we do the check for both exponential and gamma, as it improves overall performance.

To save a byte, indexing the string "EGTBU" is done instead of directly evaluating to a string within the conditionals.

For testing, save the txt files into a directory (keeping the names as-is), and run the Julia REPL in that directory. Then, attach the function to a name as

f=k->"EGTBU"[(V=std(k);any(k.>1)?V>.34?1:2:V<.236?3:V>.315?4:5)]

and use the following code to automate the testing (this will read from the file, convert into an array of arrays, use the function, and output for each mismatch):

m=0;for S=["B","E","G","T","U"] K=open(S*".txt");F=readcsv(K);
M=Array{Float64,1}[];for i=1:100 push!(M,filter(j->j!="",F[i,:]))end;
close(K);n=0;
for i=1:100 f(M[i])!=S[1]&&(n+=1;println(i," "S,"->",f(M[i])," ",std(M[i])))end;
println(n);m+=n;end;println(m)

Output will consist of rows containing the case that mismatched, the correct distribution -> the determined distribution, and the variance calculated (eg. 13 G->E 0.35008999281668357 means that the 13th row in G.txt, which should be a gamma distribution, is determined to be an exponential distribution, with the standard deviation being 0.35008999...)

After each file, it also outputs the number of mismatches for that file, and then at the end it also displays the total mismatches (and it should read 2 if run as above). Incidentally, it should have 1 mismatch for G.txt and 1 mismatch for U.txt

Glen O

Posted 2015-11-03T16:52:33.897

Reputation: 2 548

7

R, 202 192 184 182 162 154 bytes + 0 errors

function(x)c("U","T","B","E","G")[which.max(lapply(list(dunif(x),sapply(x,function(y)max(0,2-4*abs(.5-y))),dbeta(x,.5,.5),dexp(x,2),dgamma(x,3,6)),prod))]

This is based on the Bayesian formula P(D=d|X=x) = P(X=x|D=d)*P(D=d)/P(X=x), where D is the distribution and X is the random sample. We pick the d such that P(D=d|X=x) is greatest of the 5.

I assume a flat prior (i.e. P(D=di) = 1/5 for i in [1,5]), which means that P(D=d) in the numerator is the same in all cases (and the denominator would be the same in all cases anyways), so we can golf away everything but the P(x=X|D=d), which (except for the triangular distribution) simplify to native functions in R.

ungolfed:

function(x){
  u=prod(dunif(x))
  r=prod(sapply(x,function(y)max(0,2-4*abs(.5-y))))
  b=prod(dbeta(x,.5,.5))
  e=prod(dexp(x,2))
  g=prod(dgamma(x,3,6))
  den=.2*u+.2*r+.2*b+.2*e+.2*g
  c("U","T","B","E","G")[which.max(c(u*.2/den,r*.2/den,b*.2/den,e*.2/den,g*.2/den))]
}

Note that the ungolfed version is not exactly equivalent to the golfed version because getting rid of the denominator avoids the case of Inf/Inf which occurs if you allow the beta distribution to be over the closed interval [0,1] instead of (0,1) - as the sample data does. An additional if statement would handle that but since it's for illustrative purposes only it's probably not worth adding the complexity that is not at the heart of the algorithm.

Thanks @Alex A. for additional code reductions. Especially for which.max!

njnnja

Posted 2015-11-03T16:52:33.897

Reputation: 113

1You can get this to 190 bytes by removing the line break after the opening { and the one before the closing }, and aliasing prod, e.g. P=prod, then doing P(dunif(x)), etc. The function doesn't need a name to be a valid submission, so you can remove p=. Also, excellent job. :) – Alex A. – 2015-11-04T19:22:48.880

2You can get it to 182 using the above suggestions and using which.max(c(u,r,b,e,g)) in place of c(u,r,b,e,g)==max(c(u,r,b,e,g)). – Alex A. – 2015-11-04T19:30:03.027

156: function(x){c("U","T","B","E","G")[which.max(lapply(list(dunif(x),sapply(x,function(y)max(0,2-4*abs(.5-y))),dbeta(x,.5,.5),dexp(x,2),dgamma(x,3,6)),prod))]} – Alex A. – 2015-11-05T07:04:29.493

How dare you using R for a challenge involving statistics!! – flawr – 2015-11-05T09:14:25.273

6

CJam, 76

{2f*__{(z.4<},,%,4e<"UBT"="EG"\*\$-2=i3e<=}

The source code is 43 bytes long and misclassifies 33 lists.

Verification

$ count()(sort | uniq -c | sort -nr)
$ cat score.cjam
qN%{',' er[~]
  {2f*__{(z.4<},,%,4e<"UBT"="EG"\*\$-2=i3e<=}
~N}/
$ for list in U T B E G; { echo $list; cjam score.cjam < $list.txt | count; }
U
     92 U
      6 B
      2 T
T
    100 T
B
     93 B
      7 U
E
     92 E
      8 G
G
     90 G
      6 E
      3 T
      1 U

Idea

Differentiating the exponential and gamma distribution from the remaining ones is easy, since they are the only distributions that take values greater than 1.

To decide between gamma, exponential and others, we take a look at the second highest value of the sample.

  • If it lies in [1.5, ∞), we guess gamma.

  • If it lies in [1, 1.5), we guess exponential.

  • If it lies in [0, 1), we have three remaining possibilities.

    The remaining distributions can be differentiated by the percentage of sample values that lie close to the mean (0.5).

    We divide the length of the sample by the count of values that fall in (0.3, 0.7) and take a look at the resulting quotient.

    • If it lies in (1, 2], we guess triangular.

    • If it lies in (2, 3], we guess uniform.

    • If it lies in (3, ∞), we guess beta.

Code

2f*    e# Multiply all sample values by 2.
__     e# Push to copies of the sample.
{      e# Filter; for each (doubled) value in the sample:
  (z   e#   Subtract 1 and apply absolute value.
  .4<  e#   Check if the result is smaller than 0.4.
},     e# If it is, keep the value.
,/     e# Count the kept values (K).
%      e# Select every Kth value form the sample, starting with the first.
,      e# Compute the length of the resulting array.
       e# This performs ceiled division of the sample length by K.
4e<    e# Truncate the quotient at 4.
"UBT"= e# Select 'T' for 2, 'U' for 3 and 'B' for 4.
"EG"\* e# Place the selected character between 'E' and 'G'.
\$     e# Sort the remaining sample.
-2=i   e# Extract the second-highest (doubled) value and cast to integer.
3e<    e# Truncate the result at 3.
=      e# Select 'E' for 3, 'G' for 2 and the character from before for 1.

Dennis

Posted 2015-11-03T16:52:33.897

Reputation: 196 637

3

Matlab, 428 328 bytes + 33 misclassified

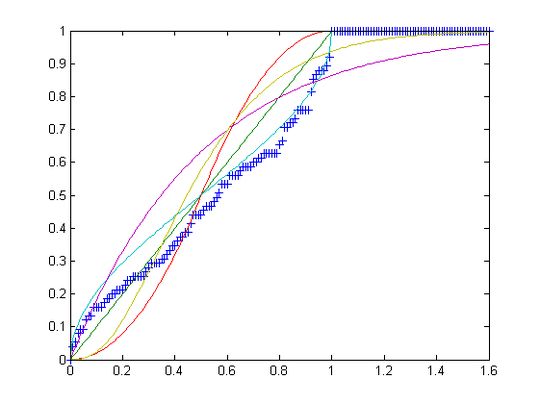
This program is basically comparing the real CDF with an estimated one given the data, and then calculating the mean distance between those two: I think the image explains more:

enter image description here

The data shown in this image here shows pretty clearly that it belongs to the turquoise distribution, as it is quite close to that one, so that is basically what my program is doing. It can probably be golfed somewhat more. For me that was first of all a conceptual challenge, not very golfy.

This approach is also independent of the pdfs chosen, it would work for any set of distributions.

Following (ungolfed) code should show how it is done. The golfed version is below.

function r=p(x);
data=sort(x(1:75));
%% cumulative probability distributiosn
fu=@(x)(0<x&x<1).*x+(1<=x).*1;
ft=@(x)(0<x&x< 0.5).* 2.*x.^2+(1-2*(1-x).^2).*(0.5<=x&x<1)+(1<=x);
fb=@(x)(0<x&x<1).*2.*asin(sqrt(x))/pi+(1<=x);
fe=@(x)(0<x).*(1-exp(-2*x));
fg=@(x)(0<x).*(1-exp(-x*6).*(1+x*6+1/2*(6*x).^2));
fdata = @(x)sum(bsxfun(@le,data,x.'),2).'/length(data);
f = {fe,fg,fu,ft,fb};
str='EGUTB';
%calculate distance to the different cdfs at each datapoint
for k=1:numel(f);
dist(k) = max(abs(f{k}(x)-fdata(x)));
end;
[~,i]=min(dist);
r=str(i);
end

Fully golfed version:

function r=p(x);f={@(x)(0<x).*(1-exp(-2*x)),@(x)(0<x).*(1-exp(-x*6).*(1+x*6+18*x.^2)),@(x)(0<x&x<1).*x+(1<=x),@(x)(0<x&x<.5).*2.*x.^2+(1-2*(1-x).^2).*(.5<=x&x<1)+(1<=x),@(x)(0<x&x<1).*2.*asin(sqrt(x))/pi+(1<=x)};s='EGUTB';for k=1:5;d(k)=max(abs(f{k}(x)-sum(bsxfun(@le,x,x.'),2).'/nnz(x)));end;[~,i]=min(d(1:5-3*any(x>1)));r=s(i)

flawr

Posted 2015-11-03T16:52:33.897

Reputation: 40 560

2

Perl, 119 bytes + 8 misclassifications = 127

I've made a tiny decision tree on three features:

  • $o: boolean: if any samples > 1.0
  • $t: count: 0-th minus 6-th 13-ile clipped into the 0-1 range,
  • $h: count: 0-th minus 6-th plus 12-th 13-ile clipped into the 0-1 range

Invoked with perl -F, -lane -e '...'. I'm not sure if I should add a penalty for the non-standard parameters. If the commas were spaces, I guess I could have gotten away without the -F,

for(@F){$b[$_*13]++;$o++if$_>1}
$h=($t=$b[0]-$b[6])+$b[12];
print$o?($t>-2?"e":"g"):($h=19?"b":"u"));
$o=@b=()

The slightly formatted output (without the -l flag) is:

bbbbbbbbbbbbbbbbbbbbbbbbbbbbbbbbbbbbbbbbbbbbbbbbbbbb
    bbbbbbbbbbbbbbbbbbbbbbbbubbbbbbbbbbbbbbbbbbbbbbb
eeeeeeeeeeeeeeeeeeeeeeeeeeeeeeeeeeeeeeeeeeeeeeeeeeee
    eeegeeeeeeeeeeeeeeeeeeeeeeeeeeeeeeeeeeeeeeeeeeee
gggggggegggggggggggggggggggggggggggggggggggggggggggg
    gggggggggggggggggggggggggggggggggggggggggggggggg
tttttttttttttttttttttttttttttttttttttttttttttttttttt
    ttttttttttttttttttttttttttttuttttttttttttutttttt
uuuuuuuuuuuuuuuuuuuuuuuuuuutuuuuuuuuuuuuuuuubuuuuuuu
    uuuuuuuuuuuuuuuuuuuuuuuuuuuuuuuuuuuuuuuuuuutuuuu

Dale Johnson

Posted 2015-11-03T16:52:33.897

Reputation: 509

0

Python, 318 bytes + 35 missclassifications

from scipy.stats import*
from numpy import*
def f(l):
    r={'U':kstest(l,'uniform')[1],'T':kstest(l,'triang',args=(.5,))[1],'B':kstest(l,'beta',args=(.5,.5))[1],'E':kstest(l,'expon',args=(0,.5,))[1],'G':kstest(l,'gamma',args=(3,0,1/6.0))[1]}
    if sum([x>1 for x in l]): r['U'],r['T'],r['B']=0,0,0
    return max(r,key=r.get)

Idea: the distribution is guessed based on the p-value of the Kolmogorov-Smirnov test.

Test

from scipy.stats import*
from numpy import*
import os
from io import StringIO
dir=os.path.dirname(os.path.abspath(__file__))+"/random-data-master/"

def f(l):
    r={'U':kstest(l,'uniform')[1],'T':kstest(l,'triang',args=(.5,))[1],'B':kstest(l,'beta',args=(.5,.5))[1],'E':kstest(l,'expon',args=(0,.5,))[1],'G':kstest(l,'gamma',args=(3,0,1/6.0))[1]}
    if sum([x>1 for x in l]): r['U'],r['T'],r['B']=0,0,0
    return max(r,key=r.get)

U=[line.rstrip('\n').split(',') for line in open(dir+'U.txt')]
U=[[float(x) for x in r] for r in U]
T=[line.rstrip('\n').split(',') for line in open(dir+'T.txt')]
T=[[float(x) for x in r] for r in T]
B=[line.rstrip('\n').split(',') for line in open(dir+'B.txt')]
B=[[float(x) for x in r] for r in B]
E=[line.rstrip('\n').split(',') for line in open(dir+'E.txt')]
E=[[float(x) for x in r] for r in E]
G=[line.rstrip('\n').split(',') for line in open(dir+'G.txt')]
G=[[float(x) for x in r] for r in G]

i,_u,_t,_b,_e,_g=0,0,0,0,0,0
for u,t,b,e,g in zip(U,T,B,E,G):
    _u+=1 if f(u)=='U' else 0
    _t+=1 if f(t)=='T' else 0
    _b+=1 if f(b)=='B' else 0
    _e+=1 if f(e)=='E' else 0
    _g+=1 if f(g)=='G' else 0
    print f(u),f(t),f(b),f(e),f(g)
print _u,_t,_b,_e,_g,100*5-_u-_t-_b-_e-_g

Aetienne Sardon

Posted 2015-11-03T16:52:33.897

Reputation: 31