Tracing the Hues of an Image

17

3

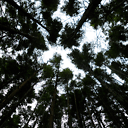
Load an image into this stack snippet and move your mouse over it. A black curve that follows the hue angle, starting at your cursor point, will be drawn:

<script src="https://ajax.googleapis.com/ajax/libs/jquery/2.1.1/jquery.min.js"></script><style>canvas{border:1px solid black;}</style>Load an image: <input type='file' onchange='load(this)'><br><br>Max length <input id='length' type='text' value='300'><br><br><div id='coords'></div><br><canvas id='c' width='100' height='100'>Your browser doesn't support the HTML5 canvas tag.</canvas><script>function load(t){if(t.files&&t.files[0]){var e=new FileReader;e.onload=setupImage,e.readAsDataURL(t.files[0])}}function setupImage(t){function e(t){t.attr("width",img.width),t.attr("height",img.height);var e=t[0].getContext("2d");return e.drawImage(img,0,0),e}img=$("<img>").attr("src",t.target.result)[0],ctx=e($("#c")),ctxRead=e($("<canvas>"))}function findPos(t){var e=0,a=0;if(t.offsetParent){do e+=t.offsetLeft,a+=t.offsetTop;while(t=t.offsetParent);return{x:e,y:a}}return void 0}$("#c").mousemove(function(t){function e(t,e){var a=ctxRead.getImageData(t,e,1,1).data,i=a[0]/255,r=a[1]/255,o=a[2]/255;return Math.atan2(Math.sqrt(3)*(r-o),2*i-r-o)}if("undefined"!=typeof img){var a=findPos(this),i=t.pageX-a.x,r=t.pageY-a.y;$("#coords").html("x = "+i.toString()+", y = "+r.toString());var o=parseInt($("#length").val());if(isNaN(o))return void alert("Bad max length!");for(var n=[i],f=[r],h=0;n[h]>=0&&n[h]<this.width&&f[h]>=0&&f[h]<this.height&&o>h;)n.push(n[h]+Math.cos(e(n[h],f[h]))),f.push(f[h]-Math.sin(e(n[h],f[h]))),h++;ctx.clearRect(0,0,this.width,this.height),ctx.drawImage(img,0,0);for(var h=0;h<n.length;h++)ctx.fillRect(Math.floor(n[h]),Math.floor(f[h]),1,1)}});</script>

I've only tested this snippet in Google Chrome.

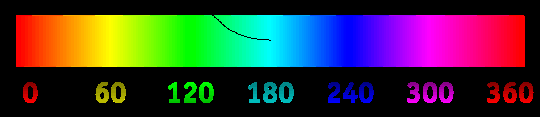
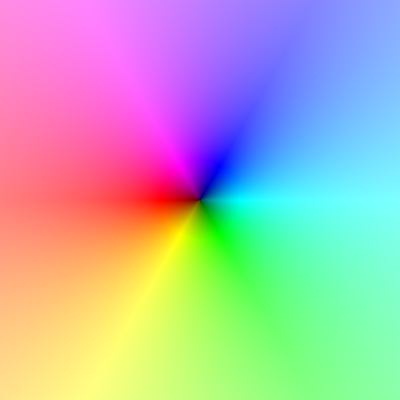
For example, when the cursor is above red, the curve has a 0° slope, but when it's above yellow, it has a 60° slope. The curve continues on for the specified length, continuously changing its slope to match the hue.

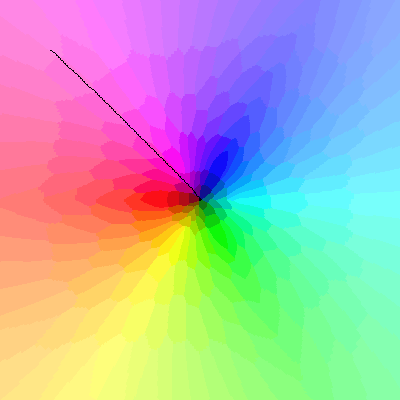
Load up this image and when you pan the cursor across it, the line just around the cursor should do a complete counter-clockwise turn:

hue angles

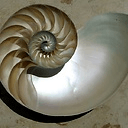
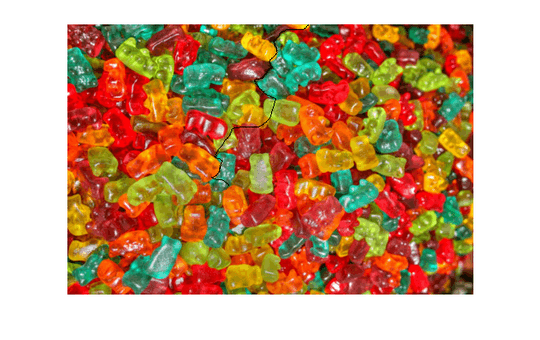
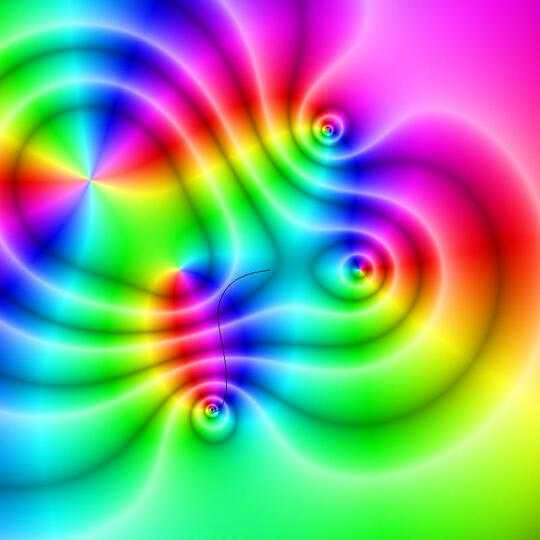
This and this are other neat images to try. (You'll need to save them and then load them with the snippet. They can't be directly linked due to cross-origin constraints.)

Here is a non-minified version of the snippet:

function load(i) { //thanks http://jsfiddle.net/vacidesign/ja0tyj0f/
    if (i.files && i.files[0]) {
        var r = new FileReader()
        r.onload = setupImage
        r.readAsDataURL(i.files[0])
    }
}

function setupImage(e) {
    img = $('<img>').attr('src', e.target.result)[0]
    function setup(c) {
        c.attr('width', img.width)
        c.attr('height', img.height)
        var ctx = c[0].getContext('2d')
        ctx.drawImage(img, 0, 0)
        return ctx
    }
    ctx = setup($('#c'))
    ctxRead = setup($('<canvas>'))
}

function findPos(obj) {
    var curleft = 0, curtop = 0;
    if (obj.offsetParent) {
        do {
            curleft += obj.offsetLeft;
            curtop += obj.offsetTop;
        } while (obj = obj.offsetParent);
        return { x: curleft, y: curtop };
    }
    return undefined;
}

$('#c').mousemove(function(e) { //thanks http://stackoverflow.com/a/6736135/3823976
    if (typeof img === 'undefined') return
    var pos = findPos(this)
    var x = e.pageX - pos.x
    var y = e.pageY - pos.y
    $('#coords').html('x = ' + x.toString() + ', y = ' + y.toString())
    var maxLength = parseInt($('#length').val())
    if (isNaN(maxLength)) {
        alert('Bad max length!')
        return
    }
    
    function hue(x, y) {
        var rgb = ctxRead.getImageData(x, y, 1, 1).data
        var r = rgb[0] / 255, g = rgb[1] / 255, b = rgb[2] / 255
        return Math.atan2(Math.sqrt(3) * (g - b), 2 * r - g - b)
    }
    
    //gather points
    var xs = [x], ys = [y]
    var i = 0
    while (xs[i] >= 0 && xs[i] < this.width && ys[i] >= 0 && ys[i] < this.height && i < maxLength) {
        xs.push(xs[i] + Math.cos(hue(xs[i], ys[i])))
        ys.push(ys[i] - Math.sin(hue(xs[i], ys[i])))
        i++
    }   
    
    //draw stuff
    ctx.clearRect(0, 0, this.width, this.height)
    ctx.drawImage(img, 0, 0)
    for (var i = 0; i < xs.length; i++)
        ctx.fillRect(Math.floor(xs[i]), Math.floor(ys[i]), 1, 1) //not using strokes because they may be anti-aliased
})
canvas {
  border:1px solid black;
}
<script src="https://ajax.googleapis.com/ajax/libs/jquery/2.1.1/jquery.min.js"></script>
Load an image: <input type='file' onchange='load(this)'>
<br><br>
Max length <input id='length' type='text' value='300'>
<br><br>
<div id='coords'></div>
<br>
<canvas id='c' width='100' height='100'>Your browser doesn't support the HTML5 canvas tag.</canvas>

Challenge

Write a program that does what the snippet is doing, just not interactively. Take an image and an (x, y) coordinate in the bounds of image, and a maximum curve length. Output the same image with the added black curve that follows the hue angles starting at (x, y) and ends when it reached the maximum length or hits an image boundary.

Specifically, start the curve at (x, y) and measure the hue angle there. Go one unit (one pixel's width) in that direction, noting that your new position is most likely not an integer coordinate. Mark another point on the curve and move again, using the hue from the closest pixel (using something like floor or round, I won't be checking this precisely). Continue on like this until the curve goes out of bounds or it exceeds the maximum length. To finish, plot all the curve points as single black pixels (again, use nearest pixels) overlayed on the image, and output this new image.

The "hue angle" is just the hue:

hue = atan2(sqrt(3) * (G - B), 2 * R - G - B)

Note that for grayscale values that don't technically have a hue, this returns 0, but that's fine.

(This formula uses atan2 which most built-in math libraries have. R, G, B are from 0 to 1, not 0 to 255.)

  • You can use any common lossless image file format as well as any image libraries.
  • Take input from stdin or the command line, or write a function with arguments for the image file name, x and y, and the max length.
  • The max length and x and y are always nonnegative integers. You can assume x and y are in range.
  • Save the output image with a name of your choice or simply display it.
  • Your implementation does not have to exactly match the snippet. A few pixels in slightly different places due to a slightly different rounding/calculation method is fine. (In chaotic cases this could lead to curves that end up majorly different, but as long as they look correct visually, it's fine.)

Scoring

The smallest submission in bytes wins.

Calvin's Hobbies

Posted 2015-03-15T11:08:42.677

Reputation: 84 000

1The snippet is completely broken in Firefox. – Ypnypn – 2015-03-15T16:18:30.593

Snippet also doesn't work in Safari. (Cool challenge though, +1) – Alex A. – 2015-03-17T03:18:25.960

@Calvin's Hobbies May we chat? http://chat.stackexchange.com/rooms/22029/permission-to-conduct-a-related-challenge

– BrainSteel – 2015-03-17T16:54:36.730

Answers

2

MATLAB, 136

function t(g,x,y,l)
m=imread(g);imshow(m); h=2*pi*rgb2hsv(m);h=h(:,:,1);s=streamline(cos(h),-sin(h),x,y,[1,l]);set(s,'LineW',1,'Co','k');

Copied most of the setup and such from @sanchises, but I instead use streamline to compute and draw the path. It does antialias the line though, and uses bilinear interpolation, rather than nearest-neighbor as specified.

AJMansfield

Posted 2015-03-15T11:08:42.677

Reputation: 2 758

5

C with SDL, 549 516 bytes

I'll start this party! For some reason, I felt like trying my hand at golf tonight. What you guys do is hard... If there's one thing I don't see any of on this site, it's SDL. I may have just found out why. This particular snippet complies with both SDL2 and SDL1.2, but is atrocious. Called like f("imagename.bmp", xcoord, ycoord, max_length);. It saves a file with the same name as given in the arguments. Output seems to be very similar to the OP's code snippet, but "fuzzier." I may try to fix this up a bit later.

#include"SDL.h"
f(char*C,x,y,m){SDL_Surface*P=SDL_LoadBMP(C);int p=P->pitch,i=P->format->BytesPerPixel,q=0;double X=x,Y=y,f=255,R,G,B,h;Uint8*Q,d=1,r,g,b,k;while(d){Q=P->pixels+y*p+i*x;SDL_GetRGB(i==4?*(Uint32*)Q:i==3?SDL_BYTEORDER==4321?*Q<<16|Q[1]<<8|Q[2]:*Q|Q[1]<<8|Q[2]<<16:i==2?*(Uint16*)Q:*Q,P->format,&r,&g,&b);R=r/f;G=g/f;B=b/f;h=atan2(sqrt(3)*(G-B),2*R-G-B);for(k=0;k<i;k++)Q[k]=0;X+=cos(h);Y-=sin(h);if((int)X-x|(int)Y-y)q++;x=X;y=Y;d=x<0|x>=P->w|y<0|y>=P->h|q>=m?0:1;}SDL_SaveBMP(P,C);SDL_FreeSurface(P);}

Here it is all unraveled:

#include"SDL.h"
f(char*C,x,y,m){
    SDL_Surface*P=SDL_LoadBMP(C);
    int p=P->pitch,i=P->format->BytesPerPixel,q=0;
    double X=x,Y=y,f=255,R,G,B,h;
    Uint8*Q,d=1,r,g,b,k;
    while(d){
        Q=P->pixels+y*p+i*x;
        SDL_GetRGB(i==4?*(Uint32*)Q:i==3?SDL_BYTEORDER==4321?*Q<<16|Q[1]<<8|Q[2]:*Q|Q[1]<<8|Q[2]<<16:i==2?*(Uint16*)Q:*Q,P->format,&r,&g,&b);
        R=r/f;
        G=g/f;
        B=b/f;
        h=atan2(sqrt(3)*(G-B),2*R-G-B);
        for(k=0;k<i;k++)Q[k]=0;
        X+=cos(h);
        Y-=sin(h);
        if((int)X-x|(int)Y-y)q++;
        x=X;y=Y;
        d=x<0|x>=P->w|y<0|y>=P->h|q>=m?0:1;
    }
    SDL_SaveBMP(P,C);
    SDL_FreeSurface(P);
}

I should note that care was taken to make it cross platform--in the interest of honesty, it didn't feel good to hardcode it for my machine, even if it cut off a substantial number of bytes. Still, I feel like a couple things are superfluous here, and I'll look at it again later.

EDIT-------

This IS Graphical Output, after all... I'll update with images that I find interesting periodically.

f("HueTest1.bmp", 270, 40, 200);

HueTest1.bmp

f("HueTest2.bmp", 50, 50, 200);

HueTest2.bmp

f("HueTest3.bmp", 400, 400, 300);

HueTest3.bmp

BrainSteel

Posted 2015-03-15T11:08:42.677

Reputation: 5 132

3

MATLAB, 186 172

The game is on! Call as t('YourImage.ext',123,456,100'), for an image of any type MATLAB supports, starting at (x,y)=(123,456) and maximum length 100. Initial positions cannot be exactly at the right and bottom edges (that would cost me two bytes), so to start on the edge, use something like x=799.99 to start at x=800. Indexing starts at 1, not 0.

Code:

function t(g,x,y,l)
m=imread(g);[Y,X,~]=size(m);h=2*pi*rgb2hsv(m);while(x>0&x<X&y>0&y<Y&l)
p=ceil(x);q=ceil(y);m(q,p,:)=0;a=h(q,p);x=x+cos(a);y=y-sin(a);l=l-1;end
imshow(m)

Revisions:

  • Changed from line from previous to next pixel to just putting a dot at a pixel, since the line will never be longer than a pixel! Still using line since that is the shortest code I know to produce a pixel.
  • Changed the color from black to blue, using Co to expand to Color (which MATLAB does automatically)
  • Changed order of calculating next position and drawing a point, since I realized thanks to @grovesNL that I was actually drawing out of bounds since I was checking bounds after changing the position.
  • Changed from drawing lines to setting rgb matrix to 0 and displaying after.

Black line candy

Sanchises

Posted 2015-03-15T11:08:42.677

Reputation: 8 530

Aren't x=0 or y=0 potentially valid positions? – grovesNL – 2015-03-29T04:31:38.490

Also, how is this 166 bytes? – grovesNL – 2015-03-29T05:05:05.433

@grovesNL Sorry, accidentally counted my test version without the function header. Spec did not require zero-based or one-based indexing, so I'm using MATLAB's one-based, so no, x=0 or y=0 is not valid in this program. – Sanchises – 2015-03-29T08:12:33.030

Ah, I forgot that MATLAB was one-based (it has been a while). But I guess that may make x=X and y=Y valid instead? – grovesNL – 2015-03-29T18:15:10.443

@grovesNL It does, but is it worth 2 bytes for the minuscule chance that floating point numbers accumulate to exactly x==X and y==Y, even though the spec says 'I won't be checking this precisely' regarding rounding? (Although of course, a 188 byte count does look prettier than 186 ;) ) – Sanchises – 2015-03-29T18:49:28.957

I meant x==X or y==Y, so it's an entire column and row you are excluding. I'm just being pedantic, don't mind me :-) – grovesNL – 2015-03-29T19:31:24.847

@grovesNL I know (no offence taken), but since I use ceil, any position x between x>X-1 and x<X is rounded to the hue value in pixel x=X, so the hue values in those columns are used as much as all the others (well, eps(X) less, but let's not get too pedantic). Remember that for a 800x800 image, you would index from 0 to 799; I already did +1 by indexing from 1 to 800. – Sanchises – 2015-03-29T19:37:20.103

Fair point, one-based array with ceil should cover that boundary. Does this give you the same results on the sample image we used above? – grovesNL – 2015-03-29T20:01:22.760

@grovesNL Yes, but really, what's the fun in posting an exact duplicate of other people's pictures? – Sanchises – 2015-03-29T20:08:36.283

Let us continue this discussion in chat.

– grovesNL – 2015-03-29T20:15:28.523

1

Hah! Beat you at your own game, my MATLAB solution is only 135 chars!

– AJMansfield – 2015-03-31T19:58:25.230

3

Python, 203 172

from scipy.misc import*
def f(i,x,y,l):
 a=imread(i);Y,X,_=a.shape;o=a.copy()
 while(X>x>0<y<Y<[]>l>0):r,g,b=a[y,x]/255.;o[y,x]=0;l-=1;x+=2*r-g-b;y-=3**.5*(g-b);imsave(i,o)

Sample output: enter image description here

Call with f("image.jpg", 400, 400, 300)

I've wasted a lot of characters for the import, if anyone has suggestions to improve it. May not work in 3.0

grovesNL

Posted 2015-03-15T11:08:42.677

Reputation: 6 736

From a quick glance: sqrt(3) -> 3**.5? I can't think of anything for the imports though. – Sp3000 – 2015-03-29T09:08:10.480

Nice one! That will be useful in the future. – grovesNL – 2015-03-29T18:18:41.080

1

Processing, 323 characters

void h(String f,float x,float y,float m){PImage i=loadImage(f);PImage i2=loadImage(f);while(m>0){color c=i.get((int)x,(int)y);float r=red(c)/255;float g=green(c)/255;float b=blue(c)/255;float h=atan2(sqrt(3)*(g-b),2*r-g-b);float dx=cos(h);float dy=-sin(h);m-=1;x+=dx;y+=dy;i2.set((int)x,(int)y,color(0));}i2.save("o.png");}

With whitespace:

void h(String f, float x, float y, float m) {
  PImage i = loadImage(f);
  PImage i2 = loadImage(f);

  while (m > 0) {

    color c = i.get((int)x, (int)y);
    float r = red(c)/255;
    float g = green(c)/255;
    float b = blue(c)/255;
    float h = atan2(sqrt(3) * (g - b), 2 * r - g - b);

    float dx = cos(h);
    float dy = -sin(h);

    m-= 1;
    x += dx;
    y += dy;

    i2.set((int)x, (int)y, color(0));
  }

  i2.save("o.png");
}

hue traced image

I'm sure I could shorten this further, but it works for now.

Kevin Workman

Posted 2015-03-15T11:08:42.677

Reputation: 308

0

JavaScript 414

function P(G,x,y,l){
I=new Image()
I.onload=function(){d=document,M=Math,C=d.createElement('canvas')
d.body.appendChild(C)
w=C.width=I.width,h=C.height=I.height,X=C.getContext('2d')
X.drawImage(I,0,0)
D=X.getImageData(0,0,w,h),d=D.data,m=255,i=0
for(;l--;i=(w*~~y+~~x)*4,r=d[i]/m,g=d[i+1]/m,b=d[i+2]/m,H=M.atan2(M.sqrt(3)*(g-b),2*r-g-b),d[i]=d[i+1]=d[i+2]=0,x+=M.cos(H),y-=M.sin(H))
X.putImageData(D,0,0)}
I.src=G}

wolfhammer

Posted 2015-03-15T11:08:42.677

Reputation: 1 219