9
In some cases, often in physics, you have to sum graphs. Your challenge is to write, in a language of your choice, a program or function that takes multiple graphs as images, calculates all possible sums, and outputs the result.
Graphs
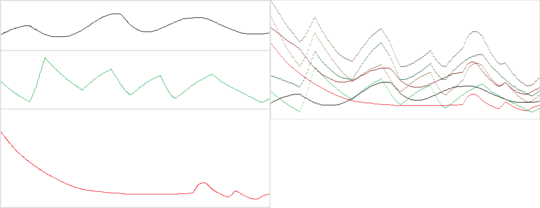
The graphs are images that contain a white (rgb(255, 255, 255)) background with a non-white pixel in each column. Examples:

The values of the script are represented as the Y positions of the colored pixels. The value at a certain X coordinate is equal to the Y position of the uppermost colored pixel in that column, with coordinates starting from 0 at the bottom left. There may or may not be additional colored pixels below those pixels for aesthetical reasons.
Task
Your task is to write, in a language of your choice, a program or function that takes multiple graphs as images, calculates all the possible 2^n - 1 sums, and outputs the result.
A sum of graphs is a graph where each column's value is equal to the sum of the values of the corresponding column in each of the input graphs.
The graphs will come in multiple colors. The result image must contain all possible sums of the graphs as other graphs, including the original graphs but excluding the zero sum.
The color of each sum is determined by the average of the colors of the graphs included, for example, graphs of colors rgb(255, 0, 255) and rgb(0, 255, 255) would produce a graph of rgb(128, 128, 255) (may also be rounded down).
The resulting image should be as high as required to fit all graphs. This means you may have to output an image larger than any of the inputs.
The order in which the resulting graphs are drawn to the resulting image does not matter, i.e. if result graphs overlap, you may choose which one is on top, but it has to be one of the graphs, not a combination of their colors.
You may assume that the input images are of equal width, that all columns of the images have at least one non-white pixel, and that the heights of the images (including output) are below 4096 pixels.
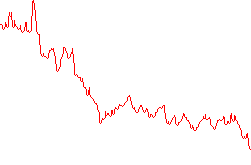
Example
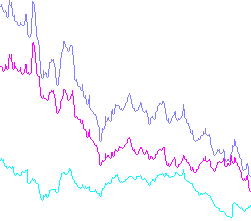
Input A:
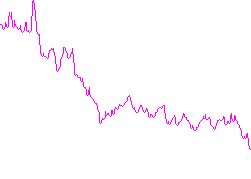
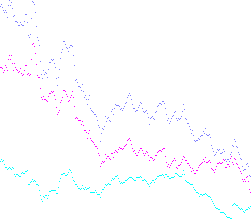
Input B:
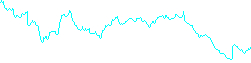
Example output:
(In case someone is interested, I copy-pasted the data for these from random companies' stock charts. That was the first way I found to get realistic data as CSV.)
Rules
- You may choose any bitmap image input file format.
- You may choose any bitmap image output file format, which doesn't have to match the input.
- You may use image processing libraries, however any functions to complete this task directly are banned.
- Standard loopholes apply.
- This is code-golf, so shortest code in bytes wins.
Graph generator script
Here is a Python 2 script that generates graphs. Input is given in lines, with the three first lines as the RGB color and the rest as data, terminated by EOF.
import PIL.Image as image
import sys

if len(sys.argv) < 2:
    sys.stderr.write("Usage: graphgen.py <outfile> [infile]")
    exit(1)
outfile = sys.argv[1]
if len(sys.argv) > 2:
    try:
        stream = open(sys.argv[2], "r")
        data = stream.read()
        stream.close()
    except IOError as err:
        if err.errno == 2:
            sys.stderr.write("File \"{0}\" not found".format(sys.argv[2]))
        else:
            sys.stderr.write("IO error {0}: {1}".format(err.errno, err.strerror))
        exit(1)
else:
    data = sys.stdin.read()

try:
    items = map(int, data.strip().split("\n"))
    red, green, blue = items[:3]
    items = items[3:]
    highest = max(items)
except (ValueError, TypeError, IndexError):
    sys.stderr.write("Invalid value(s) in input")

img = image.new("RGB", (len(items), highest + 1), (255, 255, 255))

prev = items[0]
img.putpixel((0, highest - items[0]), (red, green, blue))
for x, item in enumerate(items[1:]):
    img.putpixel((x + 1, highest - item), (red, green, blue))
    if item < prev:
        for i in range(item + 1, prev):
            img.putpixel((x, highest - i), (red, green, blue))
    else:
        for i in range(prev + 1, item):
            img.putpixel((x + 1, highest - i), (red, green, blue))
    prev = item

img.save(outfile, "png")

PurkkaKoodari
Posted 2015-03-13T20:53:09.757
Reputation: 16 699


@MartinBüttner I'm currently making one for two graphs. I'm doing it by hand (no reference impl yet), so I don't know if I have the patience for 3. Also, the three I gave can't be summed since they are of different widths. – PurkkaKoodari – 2015-03-13T21:02:23.787
So if there are
ninput graphs, there will be2^n - 1lines in the output image? – Peter Taylor – 2015-03-13T21:06:47.717@PeterTaylor Yes. – PurkkaKoodari – 2015-03-13T21:07:51.063
I take it the output doesn't actually need to contain any vertical lines? Only the top-most pixel in each column? – Martin Ender – 2015-03-13T22:25:50.743
@MartinBüttner That is correct, since that data can still be parsed as a graph as defined in the first section. – PurkkaKoodari – 2015-03-13T22:26:59.803
If the graphs overlap, do we have to choose one of the colours, or could we, say, multiply them? – Martin Ender – 2015-03-14T15:05:10.440
@MartinBüttner Let's say you have to choose one, as at least YouTube and Excel do.
– PurkkaKoodari – 2015-03-14T18:09:09.300