Play the Chaos Game

28

11

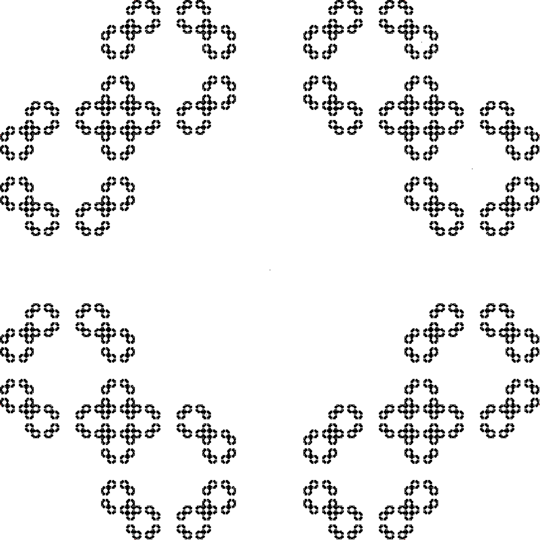
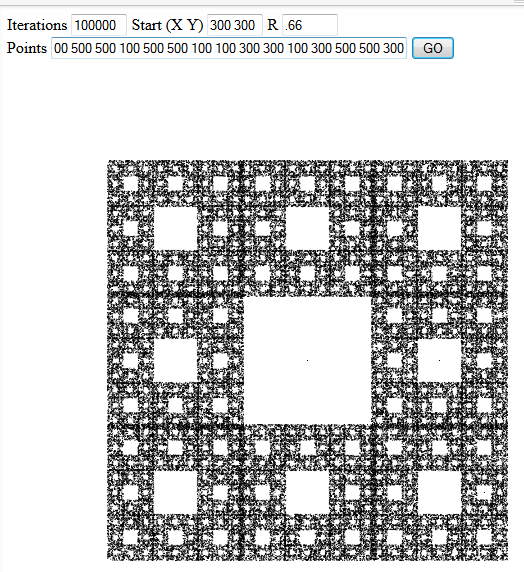
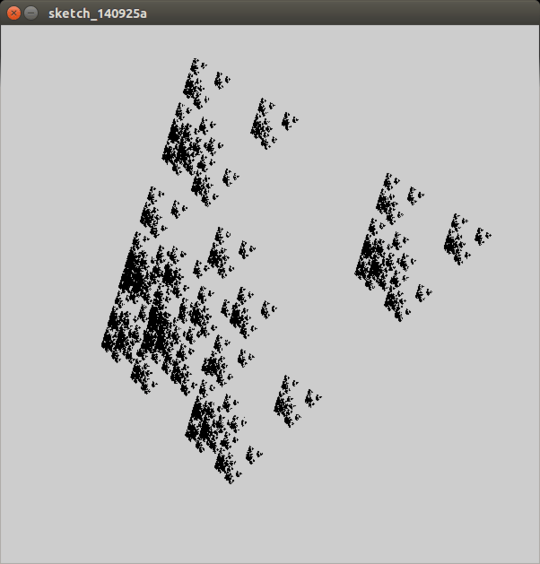
The Chaos Game is a simple method to generate fractals. Given a starting point, a length ratio r and a set of 2D points, repeatedly do the following:

  • From your set of points, pick one at random (uniformly).
  • Average that point and the last drawn point (or the starting point) using r and 1 - r as the weights (i.e. r = 0 means you get the starting point, r = 1 means you get the random point and r = 0.5 means you get the point halfway in between.)
  • Draw the resultant point.

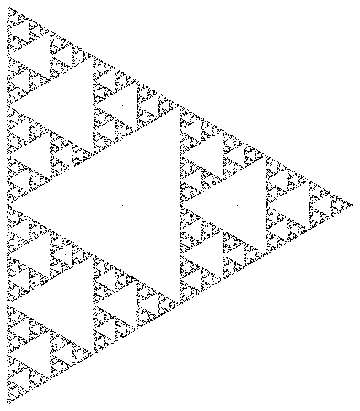
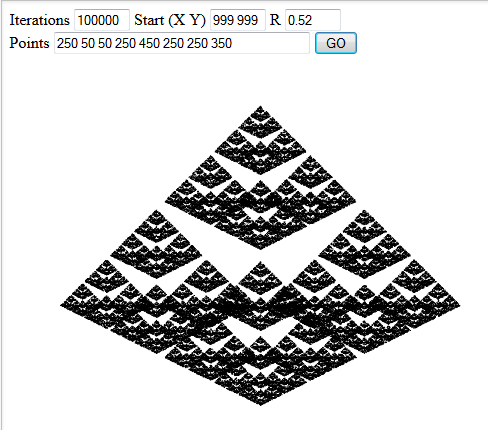
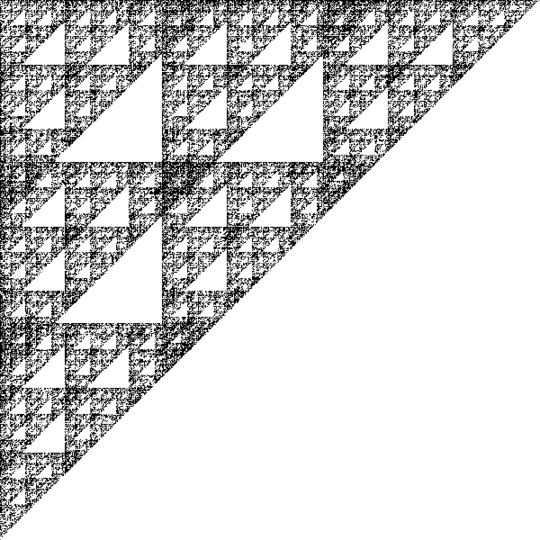
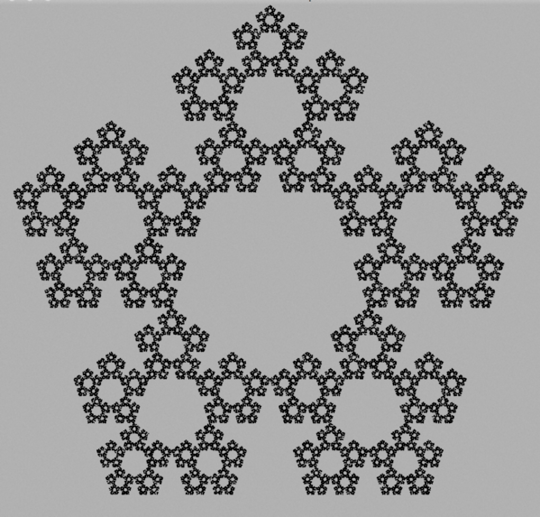
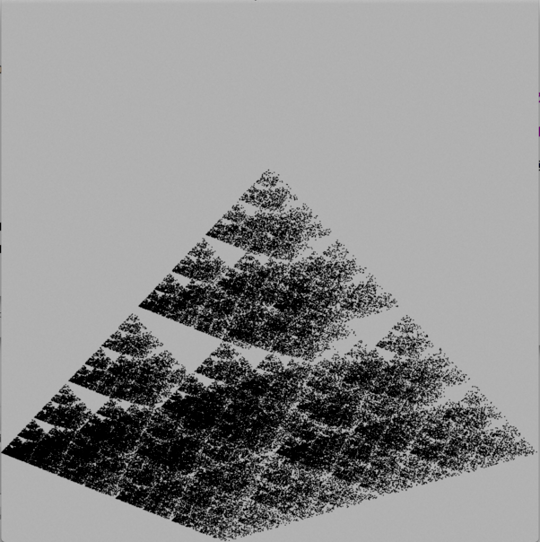
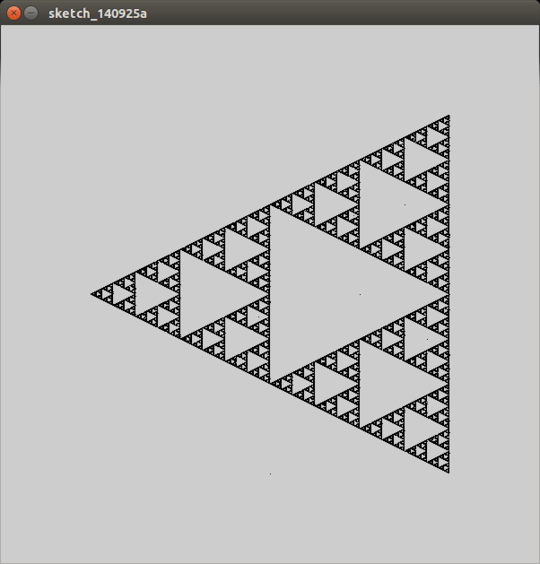
For instance, if you picked the vertices of an equilateral triangle and r = 0.5, the plotted points would map out a Sierpinski triangle:

enter image description here

Image found on Wikipedia

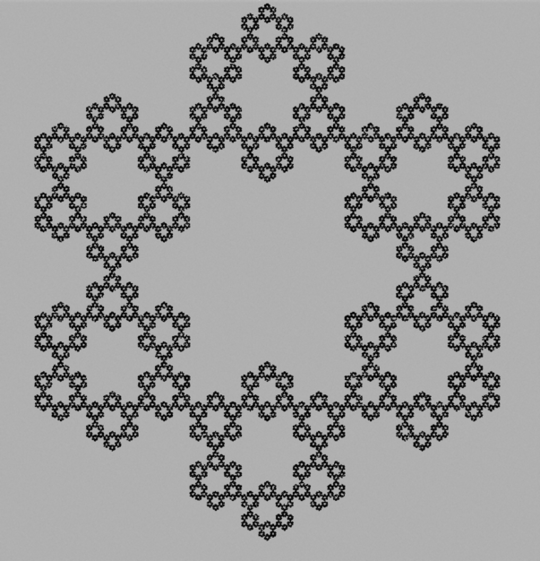
You're to write a program or function which "plays" the chaos game to create a fractal.

Input

You may write either a program or a function, and take following inputs via ARGV, STDIN or function argument:

  • The number of points to plot.
  • The starting coordinate (which has to be plotted, too!).
  • The averaging weight r in the interval [0,1].
  • A list of points to choose from.

Output

You may render on screen or write an image file. If the result is rasterised, it needs to be at least 600 pixels on each side, all points must be on the canvas, and at least 75% of the horizontal and vertical extent of the image must be used for points (this is to avoid answers with a single black pixels saying "it's really far zoomed out"). The x and y axis must be on the same scale (that is the line from (0,0) to (1,1) must be at a 45 degree angle) and each point plotted in the chaos game must be represented as a single pixel (if your plotting method anti-aliases the point, it may be spread over 2x2 pixels).

Colours are your choice, but you need at least two distinguishable colours: one for the background and one for the dots plotted during the chaos game. You may but don't have to plot the input points.

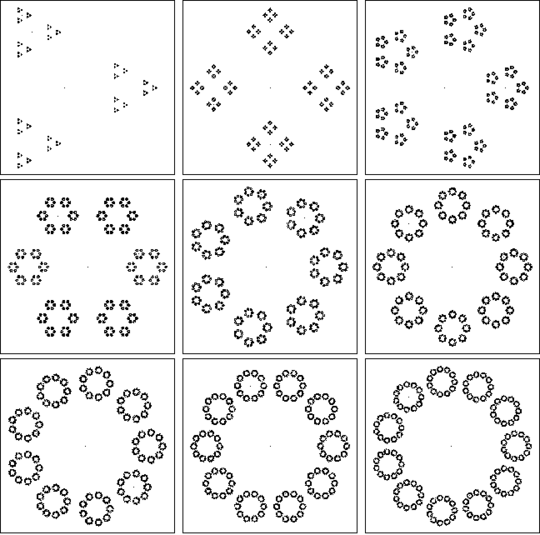
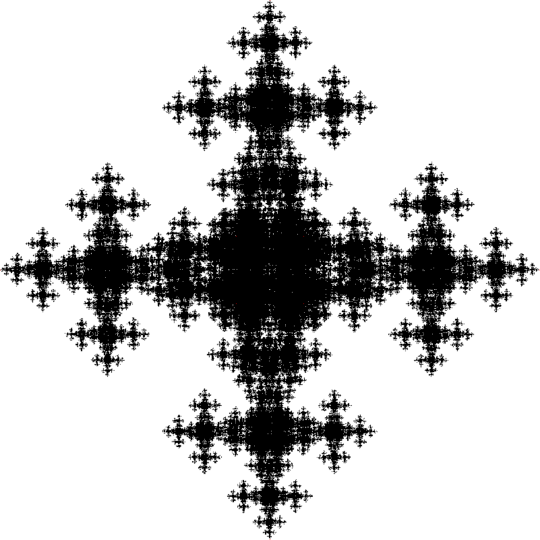
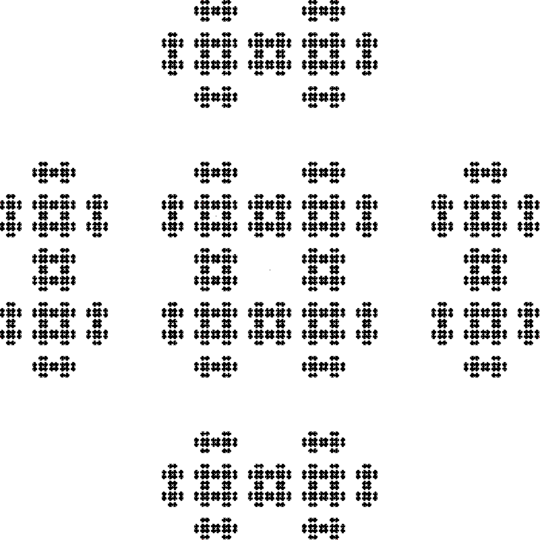
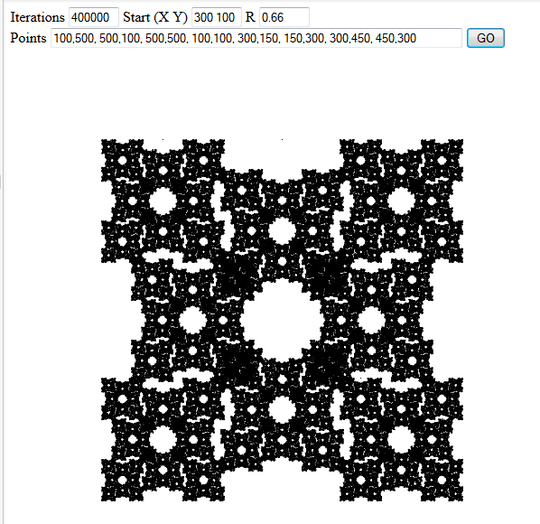
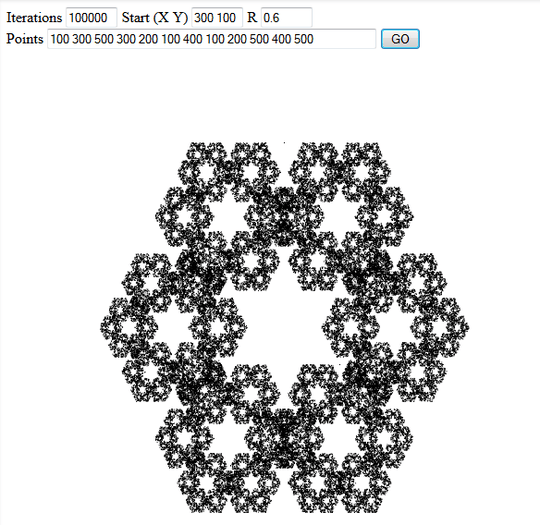
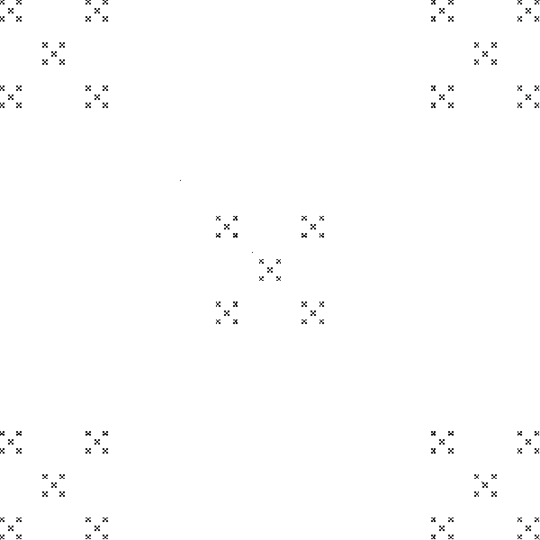
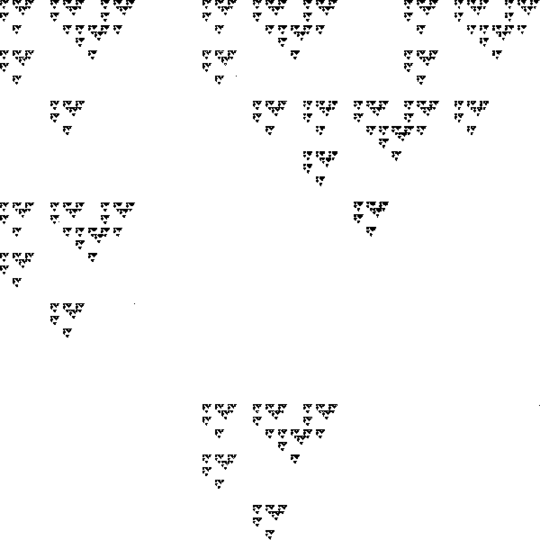
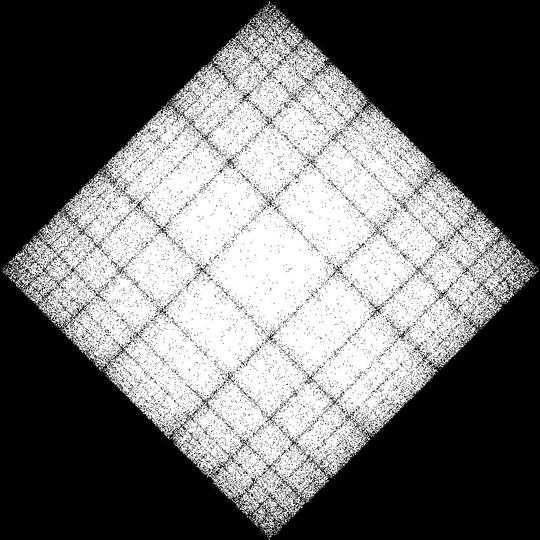
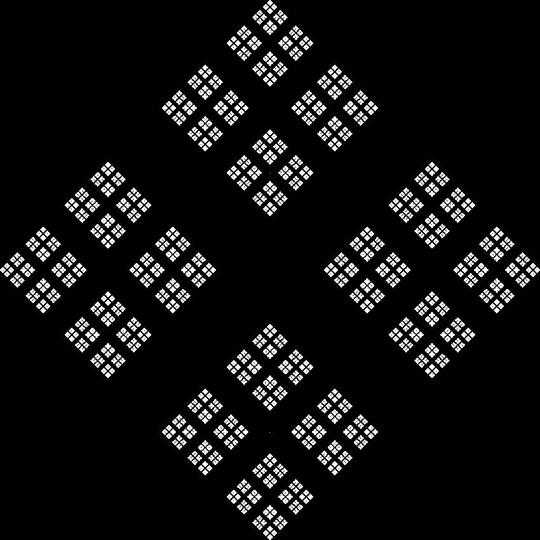
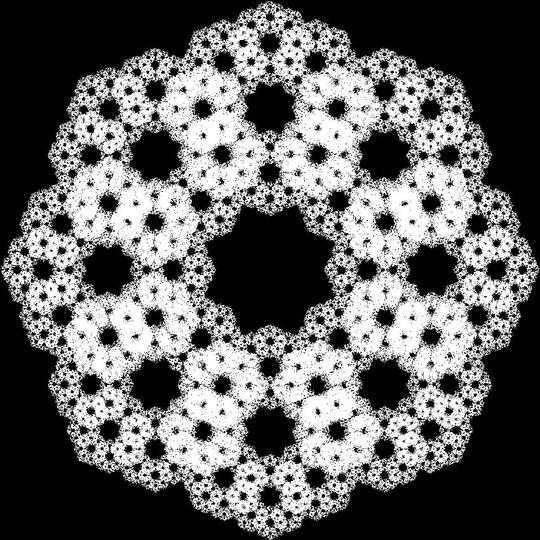
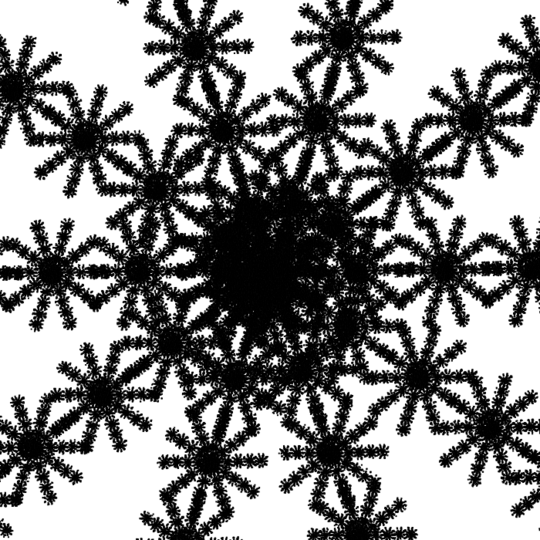
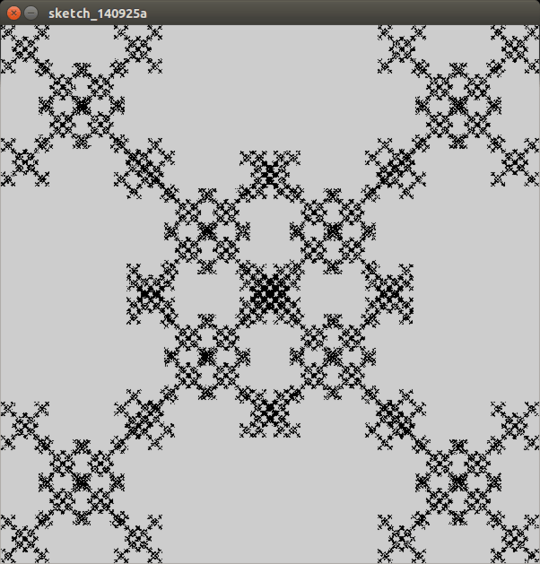
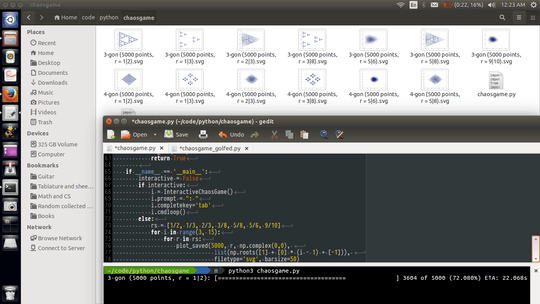
Please include three interesting example outputs in your answer.

Scoring

This is code golf, so the shortest answer (in bytes) wins.

Edit: You no longer need to plot the input points, as they aren't really visible as single pixels anyway.

Martin Ender

Posted 2014-09-25T14:18:34.887

Reputation: 184 808

What does "each point plotted ... must be represented as a single pixel" mean? Is it a) that no anti-aliasing should be used; or b) that the number of points in the second colour must be equal to the first item from the input? Note that b) is impossible to guarantee unless the iteration procedure has a test for "Does this pixel coincide with a previously plotted one?", because if the random number selector selects the same point enough times in a row then the position will converge to that point. – Peter Taylor – 2014-09-25T22:27:02.107

@PeterTaylor It was intended to avoid people plotting large dots as the points (like Mathematica does by default), but I've already noticed that anti-aliasing causes some trouble with ensuring single pixels in Soham's answer. I think I'll relax this to "must not be larger than 2x2 pixels", which should cover all the anti-aliasing trouble. – Martin Ender – 2014-09-25T22:29:09.327

I think I misunderstood something: You do always take the 'mean' of the last point you plotted and a random point of the current list. Then you add that new point to the list. Is that correct? It seems that if you have many points in one 'corner' you will get many more there but it is unlikely to get out of that cloud - at least my code always 'converges' pretty fast to points that are too close to each other to really enhance the picture. – flawr – 2014-09-26T15:26:45.043

1@flawr no, you don't add the new point to the list. The list is fixed - the algorithm only cares about the last point that was plotted, not the ones before it. – Nathaniel – 2014-09-26T15:37:24.403

Thanks, that explains a lot, should perhaps be clarified in the question. – flawr – 2014-09-26T15:46:48.993

Answers

8

Mathematica, 89

f[n_,s_,r_,p_]:=Graphics@{AbsolutePointSize@1,Point@NestList[#-r#+r RandomChoice@p&,s,n]}

f[10000, {0, 0}, .5, {{-(1/2), Sqrt[3]/2}, {-(1/2), -(Sqrt[3]/2)}, {1, 0}}]

Mathematica graphics

How it works

In Mathematica the Graphics[] function produces scalable graphics, you render it to whatever size you want by simply dragging the picture corners. In fact, the initial size of all displayed graphics is a ".ini" setting that you may set at 600 or at any other value you wish. So there is no need to do anything special for the 600x600 requirement.

The AbsolutePointSize[] thing specifies that the point size will not be modified by enlarging the image size.

The core construct is

 NestList[#-r#+r RandomChoice@p&,s,n]

or in non-golfed pseudo-code:

 NestList[(previous point)*(1-r) + (random vertex point)*(r), (start point), (iterations)]

It is recursively building a list starting from (start point) and applying the (vectorial) function in the first argument to each successive point, finally returning the list of all calculated points to be plotted by Point[]

Some self-replication examples:

Grid@Partition[Table[
   pts = N@{Re@#, Im@#} & /@ Table[E^(2 I Pi r/n), {r, 0, n - 1}];
   Framed@f[10000, {0, 0}, 1/n^(1/n), pts], {n, 3, 11}], 3]

Mathematica graphics

Dr. belisarius

Posted 2014-09-25T14:18:34.887

Reputation: 5 345

@MartinBüttner Instructions for testing this answer without Mathematica installed: 1) Download this from pastebin and save it as *.CDF 2) Download and install the free CDF environment from Wolfram Research at (not a small file). Enjoy. Tell me if it works!

– Dr. belisarius – 2014-09-25T19:48:32.557

Your golfed version doesn't quite work (at least on V10): you need to switch around #r to r# to get away without a space or * in between. – Martin Ender – 2014-09-26T10:30:14.030

@MartinBüttner Curious! It works like a charm on v9 (I don't have v10 yet). Anyway, I (blindly) swapped the # and r. – Dr. belisarius – 2014-09-26T11:45:51.980

Ah, it's a new feature. You can now apply functions to associations, in which case you get named parameters that can be accessed by #key. I'm sure that will come in handy. :) – Martin Ender – 2014-09-26T11:47:34.877

8

Java : 246 253 447

As a function m():

void m(float[]a){new java.awt.Frame(){public void paint(java.awt.Graphics g){int i=0,x=i,y=i,v;for(setSize(832,864),x+=a[1],y+=a[2];i++<=a[0];v=a.length/2-2,v*=Math.random(),x+=(a[v+=v+4]-x)*a[3],y+=(a[v+1]-y)*a[3])g.drawLine(x,y,x,y);}}.show();}

Line breaks (within a program to show usage):

class P{
    public static void main(String[]a){
        new P().m(new float[]{1000000,            // iterations
                              416,432,            // start
                              0.6f,               // r
                              416,32,16,432,      // point list...
                              416,832,816,432,
                              366,382,366,482,
                              466,382,466,482});
    }

    void m(float[]a){
        new java.awt.Frame(){
            public void paint(java.awt.Graphics g){
                int i=0,x=i,y=i,v;
                for(setSize(832,864),x+=a[1],y+=a[2];
                    i++<=a[0];
                    v=a.length/2-2,v*=Math.random(),
                    x+=(a[v+=v+4]-x)*a[3],
                    y+=(a[v+1]-y)*a[3])
                    g.drawLine(x,y,x,y);
            }
        }.show();
    }
}

Drawing input points was removed from the requirements (yay 80 bytes!). They're still shown in the old screenshots below, but won't show up if you run it. See revision history if interested.

The inputs are given as an array of floats. The first is iterations, the next two are starting x y. Fourth is r, and last comes the list of coordinates, in x1 y1 x2 y2 ... fashion.

Ninja Star

1000000 400 400 0.6 400 0 0 400 400 800 800 400 350 350 350 450 450 350 450 450

enter image description here

Cross

1000000 400 400 0.8 300 0 500 0 500 300 800 300 800 500 500 500 500 800 300 800 300 500 0 500 0 300 300 300

enter image description here

Octochains

1000000 400 400 0.75 200 0 600 0 800 200 800 600 600 800 200 800 0 600 0 200

enter image description here

Geobits

Posted 2014-09-25T14:18:34.887

Reputation: 19 061

this does't work in my computer, and java complains show is deprecated – proud haskeller – 2014-09-25T16:03:56.523

@proudhaskeller show() is deprecated, but it still works. When you say "doesn't work", what does that mean? If you don't have Java 8, you'll need to add a final to String[]a in main at least. – Geobits – 2014-09-25T16:04:52.243

Ported your answer to Processing and cut 100 chars. – user12205 – 2014-09-25T22:37:47.240

1@ace Nice. You can do that with pretty much any Java golf for graphical output, but I like that it's exactly 100 chars :D – Geobits – 2014-09-26T01:09:08.663

7

JavaScript (E6) + Html 173 176 193

Edit: big cut, thanks to William Barbosa

Edit: 3 bytes less, thanks to DocMax

173 bytes counting the function and the canvas element needed to show the output.

Test save as html file and open in FireFox.

JSFiddle

Nice


Mask


Snow


Carpet


<canvas id=C>
<script>
F=(n,x,y,r,p)=>{
  for(t=C.getContext("2d"),C.width=C.height=600;n--;x-=(x-p[i])*r,y-=(y-p[i+1])*r)
    i=Math.random(t.fillRect(x,y,1,1))*p.length&~1      
}
F(100000, 300, 300, 0.66, [100,500, 500,100, 500,500, 100,100, 300,150, 150,300, 300,450, 450,300]) // Function call, not counted
</script>

edc65

Posted 2014-09-25T14:18:34.887

Reputation: 31 086

1<canvas id=C><script>F=(n,x,y,r,p)=>{t=C.getContext("2d"),C.width=C.height=600;for(;n--;)t.fillRect(x,y,1,1),i=Math.random()*p.length&~1,x-=(x-p[i])*r,y-=(y-p[i+1])*r}</script> is 176 bytes long, I didn't understand your count – William Barbosa – 2014-09-26T11:21:17.693

@WilliamBarbosa my count is right based on my answer. With your hints it gets better - thank you! – edc65 – 2014-09-26T12:34:54.530

1You can shave off two more if you move the size initialization and y update into the for call: for(C.width=C.height=600;n--;y-=(y-p[i+1])*r) – DocMax – 2014-09-27T06:48:14.140

6

Python - 200 189

import os,random as v
def a(n,s,r,z):
    p=[255]*360000
    for i in[1]*(n+1):
        p[600*s[0]+s[1]]=0;k=v.choice(z);s=[int(k[i]*r+s[i]*(1-r))for i in(0,1)]
    os.write(1,b'P5 600 600 255 '+bytes(p))

Takes input as function arguments to a, writes result to stdout as pgm file. n is iterations, s is starting point, r is r, and z is list of input points.

Edit: No longer draws input points in gray.

Interesting outputs:

enter image description here

Iterations: 100000
Starting Point: (200, 200)
r: 0.8
Points: [(0, 0), (0, 599), (599, 0), (599, 599), (300, 300)]

enter image description here

Iterations: 100000
Starting Point: (100, 300)
r: 0.6
Points: [(0, 0), (0, 599), (599, 0), (300, 0), (300, 300), (0, 300)]

enter image description here

Iterations: 100000
Starting Point: (450, 599)
r: 0.75
Points: [(0, 0), (0, 300), (0, 599), (300, 0), (599, 300), (150, 450)]

faubi

Posted 2014-09-25T14:18:34.887

Reputation: 2 599

Some common Python character saves: Initial values like p=[255]*360000 can go as optional parameters to the function; the body of a for loop can all go on the same line if it has no control flow; you can shave parens from [1]*(n+1) as [1]*-~n; since you don't use i in the outer for loop, it's shorter to run code the n times as exec"code;"*n); I think the parens in for i in(0,1) can be removed. – xnor – 2014-09-25T19:39:29.363

6

Python, 189 183 175

Edit: fixed the inversed r ratio, and switched to B&W image in order to save a few bytes.

Takes the number of points as n, first point as p, ratio as r and list of points as l. Needs the module Pillow.

import random,PIL.Image as I
s=850
def c(n,p,r,l):
    i=I.new('L',(s,s));x,y=p;
    for j in range(n):w,z=random.choice(l);w*=r;z*=r;x,y=x-x*r+w,y-y*r+z;i.load()[x,s-y]=s
    i.show()

Examples:

I am generating points in circle around the image's center

points = [(425+s*cos(a)/2, 425+s*sin(a)/2) for a in frange(.0, 2*pi, pi/2)]
c(1000000, (425, 425), 0.4, points)

enter image description here

XOXO repetitions, just changing ratio from 0.4 to 0.6

enter image description here

Some sort of snow flake

stars = [(425+s*cos(a)/2,425+s*sin(a)/2) for a in frange(.0,2*pi, pi/4)]
c(1000000, (425, 425), 0.6, stars)

enter image description here

teh internets is made of catz

Posted 2014-09-25T14:18:34.887

Reputation: 1 881

Dunno about fixing the backwards r thing, but you can save quite a few characters by making this a program using n,p,r,l=input(). You can also remove the brackets from the *= operations and use import random as R. – FryAmTheEggman – 2014-09-26T14:28:30.207

@FryAmTheEggman Unfortunately, correcting my answer invalidates the optimisation on *= :(. The input thing would be good be very unpleasant to work with, and the import currently is the most concise form possible (or have I missed something ?). – teh internets is made of catz – 2014-09-26T14:54:04.207

I am pretty sure the line can be import random as R,PIL.Image as I and then random.choice can be R.choice. Yeah, using input is lame, but you can use the function version for testing and post the input() one for a better score!!1! :P – FryAmTheEggman – 2014-09-26T15:59:41.777

Oh, I've just noticed defining random actually saves 0 characters. Oops :S Anyway, I also realized that math is your friend: y=x*(1-r)+w == y=x-x*r-w. – FryAmTheEggman – 2014-09-26T18:33:34.807

@FryAmTheEggman that was my point :p. But thanks for the maths. – teh internets is made of catz – 2014-09-27T08:58:23.817

6

SuperCollider - 106

SuperCollider is a language for generating music, but it can do graphics at a pinch.

f={|n,p,r,l|Window().front.drawHook_({{Pen.addRect(Rect(x(p=l.choose*(1-r)+(p*r)),p.y,1,1))}!n;Pen.fill})}

I've used some obscure syntax shortcuts to save a few bytes - a more readable and more memory-efficient version is

f={|n,p,r,l|Window().front.drawHook_({n.do{Pen.addRect(Rect(p.x,p.y,1,1));p=l.choose*(1-r)+(p*r)};Pen.fill})}

at 109 chars.

As with the Mathematica example, you have to manually resize the window to get 600x600 pixels. You have to wait for it to re-draw when you do this.

This generates a basic Sierpinsky triangle (not shown because you've seen it before)

f.(20000,100@100,0.5,[0@600,600@600,300@0])

This makes a kind of Sierpinsky pentagon type thing:

f.(100000,100@100,1-(2/(1+sqrt(5))),{|i| (sin(i*2pi/5)+1*300)@(1-cos(i*2pi/5)*300)}!5)

enter image description here

The same thing with 6 points leaves an inverted Koch snowflake in the middle:

f.(100000,100@100,1/3,{|i| (sin(i*2pi/6)+1*300)@(1-cos(i*2pi/6)*300)}!6)

enter image description here

Finally, here's a riff on the 3D pyramids from ace's answer. (Note that I've used one of the points twice, to get the shading effect.)

f.(150000,100@100,0.49,[300@180, 0@500,0@500,350@400,600@500,250@600])

enter image description here

Nathaniel

Posted 2014-09-25T14:18:34.887

Reputation: 6 641

4

JavaScript (407) (190)

I'm happy to get any feedback on my script and on golfing since I am not comfortable with JS=) (Feel free to use this/change it for your own submission!)

Reading Input (To be comparable to edc65's entry I do not count the the input.):

p=prompt;n=p();[x,y]=p().split(',');r=p();l=p().split(';').map(e=>e.split(','));

Canvas Setup & Calculation

d=document;d.body.appendChild(c=d.createElement('canvas'));c.width=c.height=1000;c=c.getContext('2d');
for(;n--;c.fillRect(x,y,2,2),[e,f]= l[Math.random()*l.length|0],x-=x*r-e*r,y-=y*r-f*r);

Somewhat more ungolfed (including an example input where the real input promts are just commented out, so ready to use):

p=prompt;
n=p('n','4000');
[x,y]=p('start','1,1').split(',');
r=p('r','0.5');
l=p('list','1,300;300,1;300,600;600,300').split(';').map(e=>e.split(','));d=document;
d.body.appendChild(c=d.createElement('canvas'));
c.width=c.height=1000;c=c.getContext('2d');
for(;n--;c.fillRect(x,y,2,2),[e,f]= l[Math.random()*l.length|0],x-=x*r-e*r,y-=y*r-f*r);

Examples

for(k = 0; k<50; k++){
rad = 10;
l.push([350+rad*k*Math.cos(6.28*k/10),350+rad*k*Math.sin(6.28*k/10)]);
}
r = 1.13;

enter image description here

r = 0.5;list = [[1,1],[300,522],[600,1],[300,177]];

enter image description here

r = 0.5
list = [[350+350*Math.sin(6.28*1/5),350+350*Math.cos(6.28*1/5)],
[350+350*Math.sin(6.28*2/5),350+350*Math.cos(6.28*2/5)],
[350+350*Math.sin(6.28*3/5),350+350*Math.cos(6.28*3/5)],
[350+350*Math.sin(6.28*4/5),350+350*Math.cos(6.28*4/5)],
[350+350*Math.sin(6.28*5/5),350+350*Math.cos(6.28*5/5)],


[350+90*Math.sin(6.28*1.5/5),350+90*Math.cos(6.28*1.5/5)],
[350+90*Math.sin(6.28*2.5/5),350+90*Math.cos(6.28*2.5/5)],
[350+90*Math.sin(6.28*3.5/5),350+90*Math.cos(6.28*3.5/5)],
[350+90*Math.sin(6.28*4.5/5),350+90*Math.cos(6.28*4.5/5)],
[350+90*Math.sin(6.28*5.5/5),350+90*Math.cos(6.28*5.5/5)]];

enter image description here

flawr

Posted 2014-09-25T14:18:34.887

Reputation: 40 560

Which ones do you mean? – flawr – 2014-09-26T14:34:48.783

Oh thanks for telling me, I am gonna update the submission soon! – flawr – 2014-09-26T15:02:23.507

You linked my answer, but I do count the setup of the canvas. I just don't count the single line calling the function. Nice images anyway, espacially the first one. – edc65 – 2014-09-26T19:40:15.397

Ah I didn't notice that, I just wanted to make it 'comparable', but it's difficult when I try to rely on JS only=) @MartinBüttner Updated, now that I understood it the right way I was able to remove much of the garbage=) – flawr – 2014-09-26T19:59:14.380

3

Processing, 153

Ported @Geobits' Java answer to Processing and did some more golfing, resulting in a reduction of 100 chars. I originally intended to animate the process, but the input constraints are too harsh on this (Processing does not have stdin or argv, which means that I must write my own function instead of using Processing's native draw() loop).

void d(float[]a){int v;size(600,600);for(float i=0,x=a[1],y=a[2];i++<a[0];v=(int)random(a.length/2-2),point(x+=(a[v*2+4]-x)*a[3],y+=(a[v*2+5]-y)*a[3]));}

Complete program with line breaks:

void setup() {
  d(new float[]{100000,300,300,.7,0,600,600,0,600,600,0,0,400,400,200,200,400,200,200,400}); 
}
void d(float[]a){
  int v;
  size(600,600);
  for(float i=0,x=a[1],y=a[2];
      i++<a[0];
      v=(int)random(a.length/2-2),point(x+=(a[v*2+4]-x)*a[3],y+=(a[v*2+5]-y)*a[3]));
}

Above program gives Crosses: enter image description here

d(new float[]{100000,300,300,.65,142,257,112,358,256,512,216,36,547,234,180,360}); 

This gives Pyramids: enter image description here

d(new float[]{100000,100,500,.5,100,300,500,100,500,500});

This gives Sierpinski triangle: enter image description here

user12205

Posted 2014-09-25T14:18:34.887

Reputation: 8 752

4I love the 3D effect of the pyramids. :) – Martin Ender – 2014-09-25T22:37:25.120

1

Ungolfed "reference implementation", Python

Update: much, much faster (by orders of magnitude)

Check out the interactive shell!

Edit the file and set interactive to True, then do one of these:

polygon numberOfPoints numeratorOfWeight denominatorOfWeight startX startY numberOfSides generates, saves and displays a polygon.

points numberOfPoints numeratorOfWeight denominatorOfWeight startX startY point1X point1Y point2X point2Y ... does what the spec asks for.

enter image description here

import matplotlib.pyplot as plt
import numpy as np
from fractions import Fraction as F
import random
from matplotlib.colors import ColorConverter
from time import sleep
import math
import sys
import cmd
import time

def plot_saved(n, r, start, points, filetype='png', barsize=30, dpi=100, poly=True, show=False):
    printed_len = 0

    plt.figure(figsize=(6,6))
    plt.axis('off')

    start_time = time.clock()
    f = F.from_float(r).limit_denominator()

    spts = []
    for i in range(len(points)):
        spts.append(tuple([round(points[i].real,1), round(points[i].imag,1)]))

    if poly:
        s = "{}-gon ({}, r = {}|{})".format(len(points), n, f.numerator, f.denominator)
    else:
        s = "{} ({}, r = {}|{})".format(spts, n, f.numerator, f.denominator) 

    step = math.floor(n / 50)

    for i in range(len(points)):
        plt.scatter(points[i].real, points[i].imag, color='#ff2222', s=50, alpha=0.7)

    point = start
    t = time.clock()

    xs = []
    ys = []

    for i in range(n+1):
        elapsed = time.clock() - t
        #Extrapolation
        eta = (n+1-i)*(elapsed/(i+1))
        printed_len = rewrite("{:>29}: {} of {} ({:.3f}%) ETA: {:.3f}s".format(
                s, i, n, i*100/n, eta), printed_len)
        xs.append(point.real)
        ys.append(point.imag)
        point = point * r + random.choice(points) * (1 - r)

    printed_len = rewrite("{:>29}: plotting...".format(s), printed_len)
    plt.scatter(xs, ys, s=0.5, marker=',', alpha=0.3)

    presave = time.clock()
    printed_len = rewrite("{:>29}: saving...".format(s), printed_len)
    plt.savefig(s + "." + filetype, bbox_inches='tight', dpi=dpi)

    postsave = time.clock()
    printed_len = rewrite("{:>29}: done in {:.3f}s (save took {:.3f}s)".format(
                            s, postsave - start_time, postsave - presave),
                            printed_len)

    if show:
        plt.show()
    print()
    plt.clf()

def rewrite(s, prev):
    spaces = prev - len(s)
    sys.stdout.write('\r')
    sys.stdout.write(s + ' '*(0 if spaces < 0 else spaces))
    sys.stdout.flush()
    return len(s)

class InteractiveChaosGame(cmd.Cmd):
    def do_polygon(self, args):
        (n, num, den, sx, sy, deg) = map(int, args.split())
        plot_saved(n, (num + 0.0)/den, np.complex(sx, sy), list(np.roots([1] + [0]*(deg - 1) + [-1])), show=True)

    def do_points(self, args):
        l = list(map(int, args.split()))
        (n, num, den, sx, sy) = tuple(l[:5])
        l = l[5:]
        points = []
        for i in range(len(l)//2):
            points.append(complex(*tuple([l[2*i], l[2*i + 1]])))
        plot_saved(n, (num + 0.0)/den, np.complex(sx, sy), points, poly=False, show=True)

    def do_pointsdpi(self, args):
        l = list(map(int, args.split()))
        (dpi, n, num, den, sx, sy) = tuple(l[:6])
        l = l[6:]
        points = []
        for i in range(len(l)//2):
            points.append(complex(*tuple([l[2*i], l[2*i + 1]])))
        plot_saved(n, (num + 0.0)/den, np.complex(sx, sy), points, poly=False, show=True, dpi=dpi)

    def do_default(self, args):
        do_generate(self, args)

    def do_EOF(self):
        return True

if __name__ == '__main__':
    interactive = False
    if interactive:
        i = InteractiveChaosGame()
        i.prompt = ": "
        i.completekey='tab'
        i.cmdloop()
    else:
        rs = [1/2, 1/3, 2/3, 3/8, 5/8, 5/6, 9/10]
        for i in range(3, 15):
            for r in rs:
                plot_saved(20000, r, np.complex(0,0), 
                            list(np.roots([1] + [0] * (i - 1) + [-1])), 
                            filetype='png', dpi=300)

Soham Chowdhury

Posted 2014-09-25T14:18:34.887

Reputation: 1 449

Without running this, I have no idea what awesome means. Perhaps you could explain, or show some pictures of what makes it different from the shorter ones? – Geobits – 2014-09-25T18:53:18.473

@Geobits edited to include disclaimer and picture :) – Soham Chowdhury – 2014-09-25T18:55:45.350

4I'd prefer if you included this under a separate heading (e.g. Ungolfed Reference Implementation) in your other answer as posting only ungolfed code is technically "not an answer". – Martin Ender – 2014-09-25T18:58:59.873

-2

Python (202 chars)

Takes the number of points as n, the averaging weight as r, the starting point as a tuple s and the list of points as a list of XY tuples called l.

import random as v,matplotlib.pyplot as p
def t(n,r,s,l):
 q=complex;s=q(*s);l=[q(*i)for i in l];p.figure(figsize=(6,6))
 for i in range(n):p.scatter(s.real,s.imag,s=1,marker=',');s=s*r+v.choice(l)*(1-r)
 p.show()

Soham Chowdhury

Posted 2014-09-25T14:18:34.887

Reputation: 1 449

@MartinBüttner Does the fact that I'm taking a specific type of input meet the spec? – Soham Chowdhury – 2014-09-25T18:08:59.197

1Also, on my machine, the result is not 600x600 pixels, x and y have different length scales and the points cover more than 1 pixel. – Martin Ender – 2014-09-25T18:15:31.830