Little Chandler is sad. Draw him a cloud to cheer him up

56

7

Little Chandler is sad. Draw him a cloud to cheer him up.
Note: Drawing a cloud won't actually cheer him up.

A circle can be defined as a 3-tuple (x,y,r) where x is the x position of the circle on a Cartesian plane, y is the y position of the circle on a Cartesian plane, and r is the radius of the circle. x and y may be negative. r is always positive. The input is a list of circles in the form of space separated 3-tuples. For instance:

3,1,1 3,2,1.5 1,2,0.7 0.9,1.2,1.2 1,0,0.8

The 3,1,1 means "A circle with centre point at 3,1 with 1 radius. 3,2,1.5 means "A circle with centre point at 3,2 with 1.5 radius.

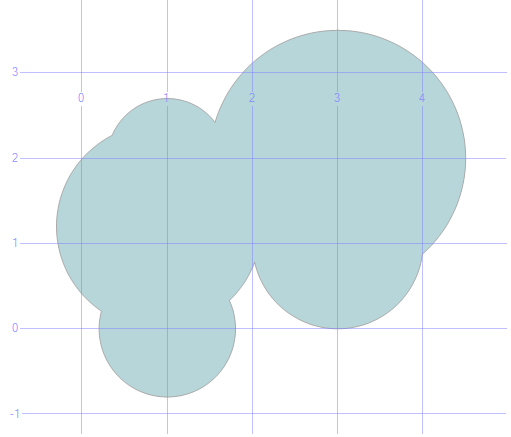
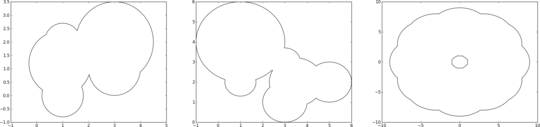
If we draw all of these circles of the input on a graph, it looks like this (I've included grid lines and labels for clarity only; they are not required):

Graph

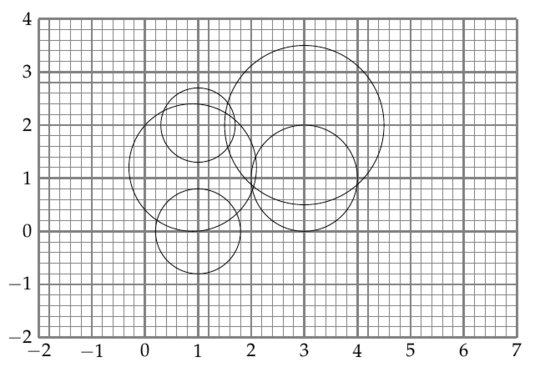
Notice how all the circles are cohesive. That is, they're all overlapped together such that it forms one large group without any small groups of circles separated from the rest. The input is guaranteed to be cohesive.

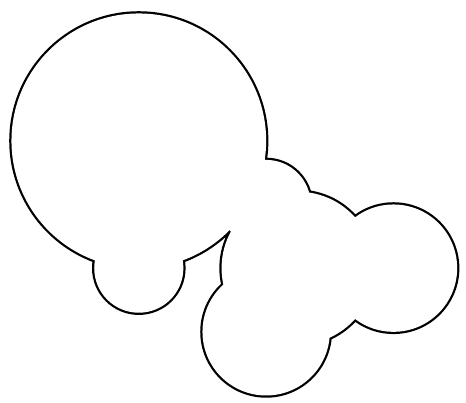
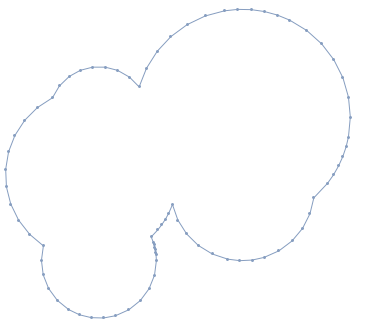
Suppose now we draw a line that travels around the "border" formed by these circles, without any of the other lines. It would be like drawing the border of the silhouette formed by all the circles. The resulting cloud would look something like this:

cloud

So this cloud has been formed by drawing only the arcs of the circles in the input that form a border, resulting in a single shape. In other words, the cloud is formed by only drawing the arcs that are not within another circle. Your program will take in input in the form explained above, and output an image that displays the resulting cloud. The overall shape of the cloud must be correct, but the scale, colour, line thickness, and how it looks at vertexes is up to you. Note that the cloud must be visible, so you can't pull something like "This program draws a white cloud on a white background", "This program draws a cloud at a infinitesimally small scale", "This program draws a cloud with 0 line thickness", etc. Also note that the colour of the border must be different from the colour of the fill or background.

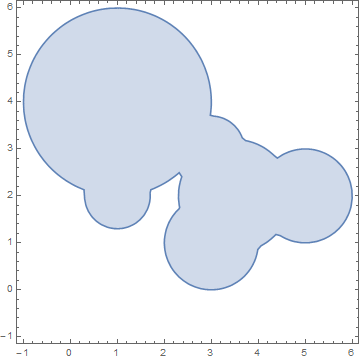
Another example. Input:

1,4,2 5,2,1 3,1,1 3.5,2,1.2 3,3,0.7 1,2,0.7

Output:

cloud2

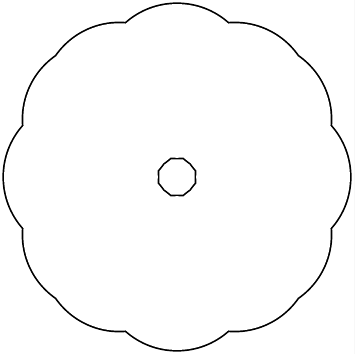
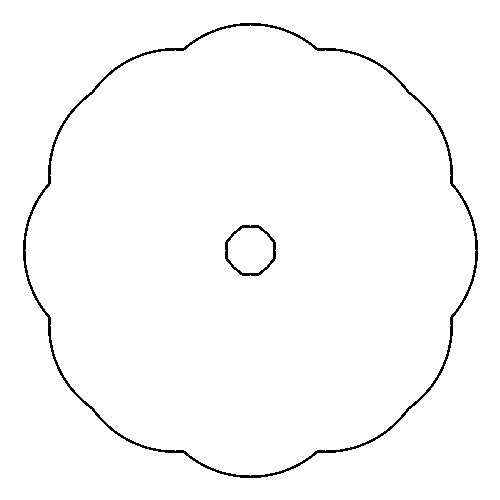
If there is a "hole" in the cloud, you should draw the hole as well. Input:

0,5,4 3,4,4 4,3,4 5,0,4 4,-3,4 3,-4,4 0,-5,4 -3,-4,4 -4,-3,4 -5,0,4 -4,3,4 -3,4,4 

Output:

cloud3

Here is an important rule: your program must draw only the lines that form the border. This means that you CANNOT simply draw the circles fully, and then draw the circles slightly smaller with a white fill -- because that method still draws lines that don't form a border, it just covers them up afterwards. The purpose of the rule was to prevent the "draw the circles, then draw the circles again with a white fill" implementations, or anything similar to that. The answer is expected to actually calculate where to draw things before drawing it.

This is code golf, so the shortest character count wins.

absinthe

Posted 2014-09-23T03:47:37.873

Reputation: 8 359

13+1 for an graphical-output question with an objective winning criterion (and the first paragraph). – Dennis – 2014-09-23T03:57:50.373

2How can you tell if we draw a line and erase it afterwards? Is rendering said lines onto internal bitmaps OK? If not, where is the border, between a vector and a bitmap representation? If yes, why not let us do the same with the primary canvas (that we know is double-buffered, so that the user can't see our temporary lines)? – John Dvorak – 2014-09-23T04:03:02.043

1​​​​​​​​​​​​​​​@JanDvorak The purpose of the rule was to prevent the "draw the circles, then draw the circles again with a white fill" implementations, or anything similiar to that. The answer is expected to actually calculate where to draw things before drawing it. I'll edit to make it more clear. – absinthe – 2014-09-23T04:05:59.760

When you say the colour of the cloud is up to us, does that include the interior or only the outline? Also what about axes? Do we need to omit those? – Martin Ender – 2014-09-23T10:06:18.243

Does it have to be a full program, or a functions allowed? – Martin Ender – 2014-09-23T11:23:43.540

​​​​​​​​​​​​​​​@MartinBüttner You may omit axes. Both the interior and the outline may be whatever colour you choose. Functions are not allowed - I use the diction "your program" in the question. – absinthe – 2014-09-23T12:07:24.323

1@Lilac I doubt it would win a code golf, but would drawing the circles against a background of a different colour, and then performing edge detection be allowed? It only draws the circles once, and that is an intermediate stage that allows the line drawing function to create a new image as the output. Does this count as similar to the 2x circles method? – Baldrickk – 2014-09-23T12:46:26.870

1In the last example there is a radius -4. A typo? – edc65 – 2014-09-23T13:20:15.447

15

This question is absolutely hilarious with Cloud to Butt (https://chrome.google.com/webstore/detail/cloud-to-butt-plus/apmlngnhgbnjpajelfkmabhkfapgnoai?hl=en) installed.

– Erty Seidohl – 2014-09-23T14:25:28.537

Can I "output" a svg file ? – user80551 – 2014-09-23T15:11:01.033

1@Erty I've got that! I read through the example and was thinking "That doesn't look like a butt at all..." – SomeKittens – 2014-09-23T20:44:58.360

@edc65 That's a typo, yes. It's supposed to be 4. Will edit.​​​​​​​​​​​​​​​ – absinthe – 2014-09-23T20:46:53.383

​​​​​​​​​​​​​​​@user80551 Yes. – absinthe – 2014-09-23T20:48:57.287

9@SomeKittens I lost it at "If there is a "hole" in the cloud, you should draw the hole as well." – Erty Seidohl – 2014-09-23T20:59:34.393

@Baldrickk - That's okay. As long as it's not the drawing circles with a slightly smaller radius method. ​​​​​​​​​​​​​​​ – absinthe – 2014-09-23T21:01:45.763

By "as long as it's not the drawing circles with a slightly smaller radius method" do you mean that I can make a black background and draw white borderless circles on it? – user12205 – 2014-09-25T20:14:04.010

@ace No. That's not really in the spirit of the question​​​​​​​​​​​​​​​ - I'll edit for a new rule to exclude that. – absinthe – 2014-09-25T20:45:22.070

@SomeKittens I was going to say, those are some horribly deformed butts it's drawing! – Doktor J – 2014-09-26T15:33:56.977

Answers

25

Mathematica 177 126 121 119

Solving by Disk Regions: the mathematician's approach

The logic is to

  • Create Region 1 (R1), the circles (without their interiors);
  • Create Region 2 (R2), the disks (without the circle borders).
  • Create Region 3 (R3 = R1-R2).
  • -

region inference

This is precisely the approach taken below. It produced the 3 figures above.

input = "3,1,1 3,2,1.5 1,2,0.7 0.9,1.2,1.2 1,0,0.8";
circles = ((x - #)^2 + (y - #2)^2 == #3^2) & @@@ 
     ToExpression[#~StringSplit~","] &@(StringSplit@input);
R1 = ImplicitRegion[Or @@ circles, {x, y}];
r1 = RegionPlot[R1, PlotLabel -> "R1: circles containing borders", 
   AspectRatio -> 1, PlotRange -> {{-1, 5}, {-1, 5}}];

innerDisks = ((x - #)^2 + (y - #2)^2 < #3^2) & @@@ 
     ToExpression[#~StringSplit~","] &@(StringSplit@input);
R2 = ImplicitRegion[Or @@ innerDisks, {x, y}];
r2 = RegionPlot[R2, PlotLabel -> "R2: disks within circle borders", 
   AspectRatio -> 1, PlotRange -> {{-1, 5}, {-1, 5}}];
R3 = RegionDifference[R1, R2]
r3 = RegionPlot[R3, PlotLabel -> "R3 = R1-R2", AspectRatio -> 1, 
   PlotRange -> {{-1, 5}, {-1, 5}}];
GraphicsGrid[{{r1, r2, r3}}, ImageSize -> 600]

Implicit region #1 is the union of the circles. Implicit region #2 is the union of the disks lying within the circles. Their difference is the border.

RegionDifference[
ImplicitRegion[(-3 + x)^2 + (-1 + y)^2 == 1 || (-3 + x)^2 + (-2 + y)^2 == 2.25 || (-1 + x)^2 + (-2 + y)^2 == 0.49 || (-0.9 + x)^2 + (-1.2 + y)^2 == 1.44 || (-1 + x)^2 + y^2 == 0.64, {x, y}],
ImplicitRegion[(-3 + x)^2 + (-1 + y)^2 < 1 || (-3 + x)^2 + (-2 + y)^2 < 2.25 || (-1 + x)^2 + (-2 + y)^2 < 0.49 || (-0.9 + x)^2 + (-1.2 + y)^2 < 1.44 || (-1 + x)^2 + y^2 < 0.64, {x, y}]]


Solving by Disk Regions: the engineer's approach (119 chars)

The following takes the union of the disk regions, discretizes that region, and finds it's boundary. The points in the diagram demarcate the intervals of the Delaunay mesh. We display the discretized region below to highlight the object that furnishes the boundary of interest (the outline of the cloud).

s = StringSplit;RegionBoundary@DiscretizeRegion[RegionUnion[Disk[{#, #2}, #3] &@@@
ToExpression[#~s~","] &@(s@InputString[])]]

"3,1,1 3,2,1.5 1,2,0.7 0.9,1.2,1.2 1,0,0.8"

The region boundary is discretized.

reg1


Solving by Detecting Edges: The Photographer's Approach - 121 chars

edge detection

It draws the disks in black, rasterizes the image, detects the edges, and inverts black and white.

s=StringSplit;ColorNegate@EdgeDetect@Rasterize@Graphics[Disk[{#,#2},#3]&@@@
((ToExpression/@s[#,","])&/@s[InputString[]])]

DavidC

Posted 2014-09-23T03:47:37.873

Reputation: 24 524

Shaved off 5 bytes: RegionBoundary@DiscretizeRegion@RegionUnion[{#,#2}~Disk~#3&@@@ToExpression[#~s~","]&@s@InputString[s=StringSplit]] – Martin Ender – 2014-09-24T11:17:16.057

Potentially the s=StringSplit inside the prompt? Try moving that in front again, should still be shorter than your current version. – Martin Ender – 2014-09-24T12:02:56.657

27

T-SQL 235 234 229 212 171 73 bytes

This makes use of spatial functionality in SQL Server 2012+. When it is run in SSMS (SQL Server Management Studio) is produces a spatial results pane. The input is from variable @i. I could reduce it further if the input could be taken from a table.

Since table input is now allowed.

SELECT Geometry::UnionAggregate(Geometry::Point(X,Y,0).STBuffer(R))FROM A

I've left the previous solution below.

DECLARE @ VARCHAR(999)='WITH a AS(SELECT *FROM(VALUES('+REPLACE(@i,' ','),(')+'))A(X,Y,R))SELECT Geometry::UnionAggregate(Geometry::Point(X,Y,0).STBuffer(R))FROM a'EXEC(@)

Edit: Remove stray space, surplus into and subquery

171: Replaced table creation with CTE and @s with @.

enter image description here

Break down of the Dynamic SQL

DECLARE @i VARCHAR(100) = '1,4,2 5,2,1 3,1,1 3.5,2,1.2 3,3,0.7 1,2,0.7' -- Input
DECLARE @ VARCHAR(999) = '
WITH a AS(                                       --CTE to produce rows of x,y,r 
    SELECT *FROM(VALUES('+
        REPLACE(@i,' ','),(')                    --Format @i to a value set
        +'))A(X,Y,R)
)
SELECT Geometry::UnionAggregate(                 --Aggregate Buffered Points
    Geometry::Point(X,Y,0).STBuffer(R)           --Create point and buffer
    )               
FROM a                                           --from the table variable
'
EXEC(@)                                          --Execute Dynamic sql

MickyT

Posted 2014-09-23T03:47:37.873

Reputation: 11 735

Nice work with SQL geometry functions. Good news! Input by pre-existing table is now explicitly allowed. Table creation and population need not be included in the byte count.

– BradC – 2018-01-11T15:44:59.830

I golfed a few characters. The link doesn't produce a result. But it works in ms-sql server management studio. Script is here, enjoy. Feel free to use it

– t-clausen.dk – 2019-03-22T09:54:44.080

@t-clausen.dk thanks for that, but since I am going to update it I will change it to allowed table input. I wasn't going to dredge this one back up, but... – MickyT – 2019-03-22T21:42:28.780

I'm getting an error saying 'A' has fewer columns than were specified in the column list – Jesan Fafon – 2014-09-26T18:34:56.590

@JesanFafon Make sure your input variable @i is set correctly. DECLARE @i VARCHAR(100) = '1,4,2 5,2,1 3,1,1 3.5,2,1.2 3,3,0.7 1,2,0.7'. Unfortunately I can't test at he moment and SQLfiddle isn't playing nicely for 2012. – MickyT – 2014-09-26T19:05:49.777

23

Mathematica, 175 158 149 bytes

s=StringSplit;l=ToExpression[#~s~","]&@s@InputString[];RegionPlot[Or@@(Norm@{x-#,y-#2}<#3&@@@l),{x,m=Min@(k={{##}-#3,{##}+#3}&@@@l),M=Max@k},{y,m,M}]

I remember from discussion in the sandbox that this approach was supposed to be valid, but I'm not entirely sure how it sits with the new wording of the rules, so @Lilac, let me know if you think this violates the rules.

Basically, I'm creating a logical condition which is true for all points inside the cloud and false for all points outside it. I'm feeding that to RegionPlot which then renders the region of all points where the expression is True as well as an outline around it.

enter image description here

Ungolfed:

s = StringSplit;
l = ToExpression[#~s~","] &@s@InputString[];
RegionPlot[
 Or @@ (Norm@{x - #, y - #2} < #3 & @@@ l), 
 {x, m = Min@(k = {{##} - #3, {##} + #3} & @@@ l), M = Max@k},
 {y, m, M}
]

Martin Ender

Posted 2014-09-23T03:47:37.873

Reputation: 184 808

1ImplicitRegion automatically finds the proper x and y values for plotting. 122 chars: s = StringSplit; RegionPlot@ ImplicitRegion[ Or @@ (((x - #)^2 + (y - #2)^2 < #3^2) & @@@ (ToExpression[#~s~","] &@(s@InputString[]))), {x, y}] – DavidC – 2014-09-23T23:31:54.333

@DavidCarraher Unfortunately, this distorts the aspect ratio of the image. (Nice to know all those region functions though - also the ones you used - I've only seen RegionPlot so far.) – Martin Ender – 2014-09-24T08:25:16.337

You probably already noted that ,AspectRatio-> 1 brings the code back to 149 bytes, exactly where it stands now. – DavidC – 2014-09-24T11:59:54.133

2Is it me or does this image look like Marvin the Paranoid Android? – paqogomez – 2014-09-24T19:33:20.077

16

Python 3.3 (183 177 164 160 bytes)

B=list(map(eval,input().split()))
print("".join(" ## "[sum(any(r*r>(x-d%80/4+10)**2+(y+d//80/4-10)**2for
x,y,r in B)for d in[i,i+1,i+80])]for i in range(6400)))

It requires an 80 character wide console, which I know is the default in Windows. It works best if your console has a square font. Here are some excerpts from some of the test inputs.

Original:

           ########
          ##       #
         ##         #
     #####          #
    ##   #          #
   ##               #
  ##                #
 ##                 #
 #                  #
 #                 ##
  #               ##
  #       ##      #
   #      # #    ##
   #      #  #####
   #      #
    #    ##
     #  ##
      ###

Another:

    ########
  ###       ##
 ##           #
 #            #
##             #
#              #
#              #
#              #
#              #
#               ##
#                 #
 #                 ##
 #                   ######
  #                        #
   ##      ###             #
     #    ## #             #
     #    #  #             #
      #  ## ##             #
       ###  #             ##
            #       #######
            #      ##
            #      #
             #    ##
              #####

Hole:

                              ############
                            ###           ##
                          ###               ##
                         ##                   #
                  ########                     #######
                ###                                   ##
              ###                                       ##
             ##                                           #
            ##                                             #
           ##                                               #
          ##                                                 #
         ##                                                   #
        ##                                                     #
       ##                                                       #
      ##                                                         #
      #                                                          #
     ##                                                           #
     #                                                            #
    ##                                                             #
    #                                                              #
    #                                                              #
    #                                                              #
    #                                                              #
    #                                                              #
    #                                                              #
   ##                                                               #
  ##                                                                 #
  #                                                                  #
 ##                                                                   #
 #                                                                    #
##                                                                     #
#                                 ####                                 #
#                                ##   #                                #
#                               ##     #                               #
#                              ##       #                              #
#                              #        #                              #
#                              #        #                              #
#                               #      ##                              #
#                                #    ##                               #
#                                 #  ##                                #
#                                  ###                                 #
 #                                                                    ##
 #                                                                    #
  #                                                                  ##
  #                                                                  #
   #                                                                ##
    #                                                              ##
    #                                                              #
    #                                                              #
    #                                                              #
    #                                                              #
    #                                                              #
    #                                                              #
     #                                                            ##
     #                                                            #
      #                                                          ##
      #                                                          #
       #                                                        ##
        #                                                      ##
         #                                                    ##
          #                                                  ##
           #                                                ##
            #                                              ##
             #                                            ##
              #                                          ##
               ##                                      ###
                 ##                                  ###
                   #######                    ########
                          #                  ##
                           ##              ###
                             ##          ###
                               ###########

recursive

Posted 2014-09-23T03:47:37.873

Reputation: 8 616

1I love that this is the only ascii art solution. – vmrob – 2014-09-26T23:50:44.287

no imports... impressive! – Richard Green – 2014-09-29T16:11:14.533

15

Python - 253 249 215 199

This is an advertisement for the awesome shapely library, whose geometry operations made writing the solution straightforward by drawing the outline(s) of the union of overlapping circles (=buffered points):

from pylab import*
from shapely.geometry import*
c=Point()
for s in raw_input().split():
 x,y,r=eval(s)
 c=c.union(Point(x,y).buffer(r))
plot(*c.exterior.xy)
for i in c.interiors:
 plot(*i.xy)
show()

Output:

three clouds

Edit(s):

  • 249: Replaced sys.argv[1:] by raw_input().split(), saving a import sys
  • 215: Removed k={'color':'k'} luxury, replaced savefig by show
  • 199: Replaced map(float,s.split(',')) by eval(s)

ojdo

Posted 2014-09-23T03:47:37.873

Reputation: 410

11

Python – 535

import math as m
import matplotlib.pyplot as l
c = "3,1,1 3,2,1.5 1,2,0.7 0.9,1.2,1.2 1,0,0.8"
a = [[float(y) for y in x.split(",")] for x in c.split(" ")]
for a2 in a:
    for x in xrange(0,200):
        q=x*m.pi/100.0
        p=(a2[0]+m.sin(q)*a2[2], a2[1]+m.cos(q)*a2[2])
        cc = []
        for z in a:            
            if z != a2:               
                if ((z[0] - p[0]) ** 2 + (z[1] - p[1]) ** 2 ) < (z[2] ** 2) :
                    cc.append(z)
        if not cc: 
            l.scatter(p[0],p[1])
l.show()

Richard Green

Posted 2014-09-23T03:47:37.873

Reputation: 211

2

This has a lot potential for being golfed down further, e.g., by from math import* removing unneded spaces, using one-letter variable names only, using list comprehension (e.g., cc=[z for z in a if z!=a2 and (z[0]…)]). Also take a look at the tips for golfing in Python.

– Wrzlprmft – 2014-09-23T15:57:02.137

You could save some characters by using a one-letter variable name instead of a2. – ProgramFOX – 2014-09-23T16:11:06.017

thanks wrzl... I will probably start golfing tonight (other things to do right now but wanted to put a stake in the ground) – Richard Green – 2014-09-23T16:11:32.130

1yes @ProgramFOX ... this was a version that worked and that I could debug.. will get it shorter tonight... – Richard Green – 2014-09-23T16:13:36.157

Had a play with this and managed to get it down to 320 chars. – James Williams – 2014-09-23T18:56:26.557

3@JamesWilliams if you want to take the baton... please do .. I'm not protective of the code !! Feel free to add it as your own entry (as long as you credit the original !) – Richard Green – 2014-09-23T20:13:27.040

Sure, I'll add it as my own answer, and credit you in there. I'm sure it can be golfed further but I'm new to this and I think I have got it as far as I can go. Thanks! – James Williams – 2014-09-23T21:09:00.033

I've golfed your code down to 418 characters. You should also use single character variables in golfing. – Beta Decay – 2014-09-24T06:14:47.560

@RichardGreen it's usually nice to have both an un-golfed version (usually what you develop to get the logic right and so people can see the logic), then crush it down to a golfed version that you score. – Nick T – 2014-09-24T18:33:41.173

Thanks @NickT .. I handed the baton over to JamesWilliams .. I don't think I'll beat his golf score – Richard Green – 2014-09-25T09:57:55.380

9

Python – 296 249 231 223 212

from pylab import*
a=map(eval,raw_input().split())
for x,y,r in a:
 for i in range(200):
  q=i*pi/100;p=x+r*sin(q);t=y+r*cos(q);[z for z in a if z!=(x,y,r)and(z[0]-p)**2+(z[1]-t)**2<z[2]**2]or scatter(p,t)
show()

Credit goes to @richard-green (permission was given) for the original solution, I've just whittled it down a bit.

James Williams

Posted 2014-09-23T03:47:37.873

Reputation: 1 735

7well that gets my vote... – Richard Green – 2014-09-23T21:13:32.530

1

You might be able to save some more by importing pylab instead of matplotlib.pyplot.

– ojdo – 2014-09-23T21:32:13.837

@odjo Currently on mobile, if I used from pylab import * would I still be able to call show() and scatter() without any references? – James Williams – 2014-09-23T21:40:26.330

1@JamesWilliams confirmed! Pylab is a namespace polluter, including many MATLAB-like functions :-) – ojdo – 2014-09-23T23:04:32.537

You can shorten this by using [eval(i)for i in raw_input().split()] as python's eval turns 1,2,3 into a tuple. You will also of course have to change the [x,y,r] to a (x,y,r). – KSab – 2014-09-24T01:39:37.243

You can also reduce the count by reducing the indentation to one space, and you may be able to remove it entirely. – matsjoyce – 2014-09-24T16:25:13.407

7

Python 274 bytes

This takes input from stdin and checks every point on the display, drawing the pixels one by one as it goes. Not exactly efficient but it follows all the rules.

c=[eval(s)for s in raw_input().split()]
import pygame
S=pygame.display.set_mode((500,500))
S.fill([255]*3)
for p in((x,y)for x in range(500)for y in range(500)if 0<min((((x-250)/25.-a)**2+((y-250)/25.-b)**2)**.5-r for(a,b,r)in c)<.1):S.set_at(p,[0]*3)
pygame.display.update()

Note that the pygame display will terminate as soon as the drawing is complete, I wasn't sure if I should include it as part of my answer but to view it you can either throw a raw_input in at the end or add a little loop if you want to stop the OS from complaining about it not responding and such:

alive = True
while alive:
    pygame.display.update()
    for e in pygame.event.get():
        if e.type == pygame.QUIT:
            alive = False

Example images:

1,4,2 5,2,1 3,1,1 3.5,2,1.2 3,3,0.7, 1,2,0.7 enter image description here

0,5,4 3,4,4 4,3,4 5,0,4 4,-3,4 3,-4,4 0,-5,4 -3,-4,4 -4,-3,4 -5,0,4 -4,3,4 -3,4,4 enter image description here

KSab

Posted 2014-09-23T03:47:37.873

Reputation: 5 984

3@edc65 I'm not quite sure what you mean. What it does precisely is fill in any pixel that is between 0 and 0.1 units (between 0 and 2.5 pixels) outside the circles. Are you saying it should mathematically find the correct arcs to draw? From reading the question it didn't seem like that was a restriction to me. – KSab – 2014-09-23T13:45:09.350

7

JavaScript (E6) + HTML 322

JSFiddle

Each circle is subdivided in about 100 small arcs, and each arc is drawn if its middle point is not inside any of the other circles.

<canvas id='c'/>
<script>
t=c.getContext("2d"),z=99,c.width=c.height=400,
l=prompt().split(' ').map(c=>c.split(',').map(v=>40*v)),
l.map(c=>{
  for(i=z;--i+z;)
    s=4/z,r=c[2],x=c[0]+r*Math.cos(a=i*s),y=c[1]+r*Math.sin(a),
    t.beginPath(),
    l.some(q=>c!=q&(d=x-q[0],e=y-q[1],d*d+e*e<q[2]*q[2]))||t.arc(z+c[0],z+c[1],r,a-s,a+s),
    t.stroke()
})
</script>

edc65

Posted 2014-09-23T03:47:37.873

Reputation: 31 086

4

Perl - 430

@e=map{[map{int($_*32)}split',']}(split' ',<>);for$g(@e){for(0..3){($a[$_]>($q=$$g[$_&1]+(($_>>1)*2-1)*$$g[2]))^($_>>1)&&($a[$_]=$q)}}for(2,3){$a[$_]-=$a[$_-2]-1}for(@e){($x,$y,$r)=@$_;$x-=$a[0];$y-=$a[1];for$k($x-$r..$x+$r){for$l($y-$r..$y+$r){$i=(int(sqrt(($x-$k)**2+($y-$l)**2)+0.5)<=>$r)-1;$f[$l][$k]=($j=$f[$l][$k])<-1||$i<-1?-2:$i||$j;}}}print"P1
$a[2] $a[3]
".join("
",map{join' ',map{$_+1?0:1}@$_,('0')x($a[2]-@$_)}@f)."
"

Writes a pbm file to stdout.

Test image (converted to png):

Second test image (converted to png)

faubi

Posted 2014-09-23T03:47:37.873

Reputation: 2 599