Collatz Graph Plotting

6

2

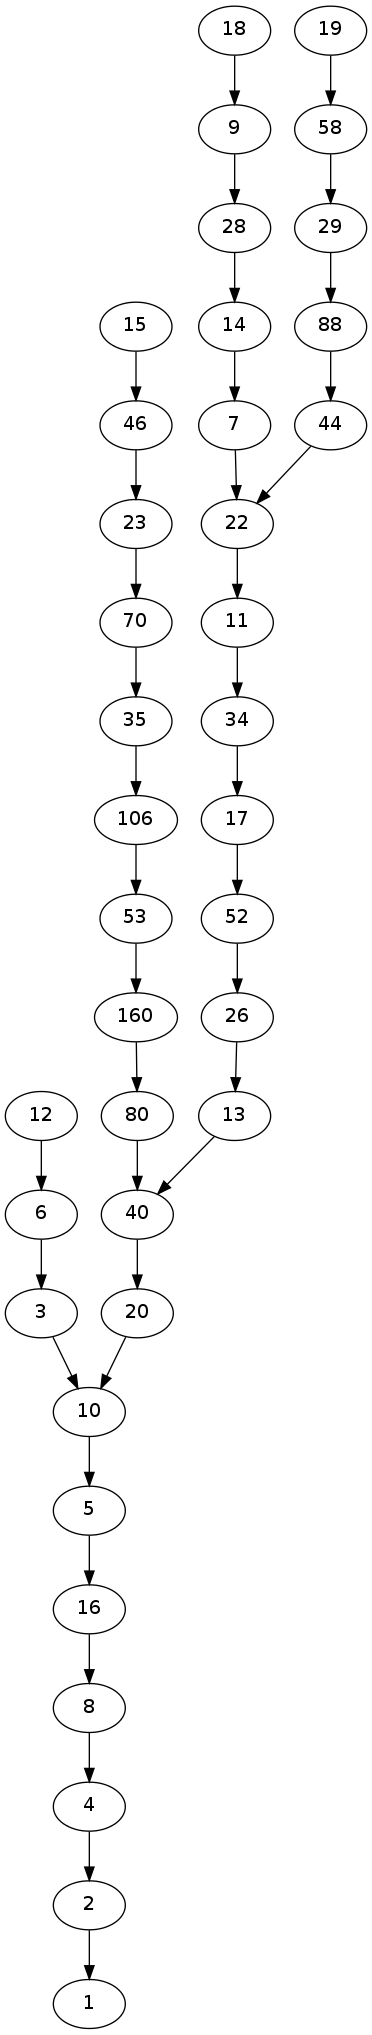
Write a program that outputs a graph of the collatz sequence any way you want (ASCII Image Video etc). You have to implement it that way that you can adjust the size of the graph by either the maximum number of nodes or highest number in graph. A boring example here.

Try to present the graph in a creative / insightful way, this is a popularity contest!

Please comment your code / algorithm and post at least one example output in your answer.

Background: Collatz sequence

The Collatz sequence is defined for any natural number n > 0 by the recursion:

enter image description here

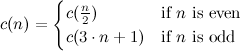
The Collatz conjecture states that the sequence ends in the cycle 1,4,2

flawr

Posted 2014-08-01T16:45:51.553

Reputation: 40 560

Question was closed 2016-12-16T15:17:50.857

4Good luck with telling people when to vote. ;) – Martin Ender – 2014-08-01T16:49:14.667

@MartinBüttner: I've got it now. I'm cleaning up comments now. – Kyle Kanos – 2014-08-01T18:47:09.710

See also: http://martin-thoma.com/the-collatz-sequence/

– Martin Thoma – 2014-08-01T18:53:57.753

Answers

4

Ruby (via ChunkyPNG)

I don't know if this is quite what you had in mind, but I had the idea to try this a while ago and hadn't gotten around to it. We create a row of random colors, then iteratively replace each color n with the color at collatz(n), or an empty pixel if greater than the max, until every sequence either escapes or converges. The result is that each pixel gradually propagates to the positions connected to it in the graph.

gem 'chunky_png'
require 'chunky_png'

def random_color
  ChunkyPNG::Color.rgba(*(1..3).map{rand(1..255)},255)
end

def collatz(n)
  n.even? ? n/2 : 3*n + 1
end

def collatz_grid(max)
  grid = []
  colors = (1..max).map { |i|  random_color  }
  collatz_steps = (1..max).map { |n| collatz(n) }
  overflow = ChunkyPNG::Color::TRANSPARENT
  while colors.uniq.count > 4
    grid << colors
    colors = collatz_steps.map { |i| colors[i-1] || overflow }
  end

  img = ChunkyPNG::Image.new(max, grid.size, ChunkyPNG::Color::TRANSPARENT)
  max.times do |x|
    grid.size.times do |y|
      img[x,y] = grid[y][x]
    end
  end
  img.save("collatz#{max}.png")
end

Images below, suggest opening them in a new window and zooming in.

collatz_grid(100): A visualization of the Collatz graph with maximum node 100

collatz_grid(10000): Maximum node 10000

histocrat

Posted 2014-08-01T16:45:51.553

Reputation: 20 600

4

Python+Graphviz

#!/usr/bin/env python
# -*- coding: utf-8 -*-

import networkx as nx
import os

"""Tool to generate collatz sequence graphs."""


def collatz_one(x):
    """Make a single step in the collatz sequence."""
    if x % 2 == 0:
        x = x/2
    else:
        x = 3*x + 1
    return x


def main(max_collatz=20):
    """Create the collatz graph. """
    G = nx.DiGraph()
    seen = [1]
    G.add_node("1")
    edges = []

    for i in range(1, max_collatz):
        while i != 1:
            if i not in seen:
                seen.append(i)
                G.add_node(str(i))
                j = collatz_one(i)
                edges.append((str(i), str(j)))
                i = j
            else:
                i = 1

    for i, j in edges:
        G.add_edge(i, j)
    nx.write_dot(G, 'test.dot')
    os.system("dot -Tpng test.dot -o test.png")

if __name__ == '__main__':
    from argparse import ArgumentParser
    parser = ArgumentParser(description=__doc__)
    parser.add_argument("-m", dest="m",
                        help=("The first 1..m elements are guaranteed "
                              "to be included"),
                        default=20,
                        type=int)

    args = parser.parse_args()
    main(args.m)

Image

Created with dot and m=20:

enter image description here

Martin Thoma

Posted 2014-08-01T16:45:51.553

Reputation: 669