289
87
I have come across an article where students used network traffic to draw their university on the country's IPv6 graph. [image]
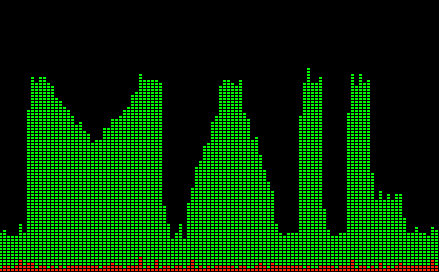
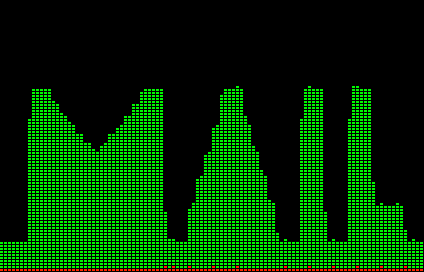
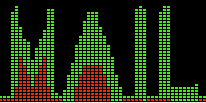
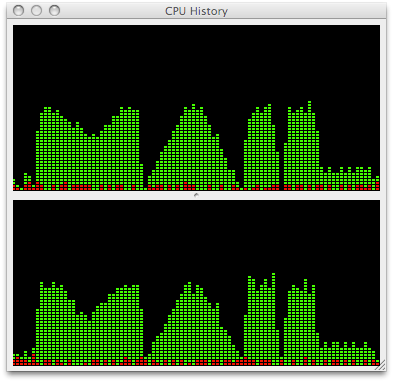
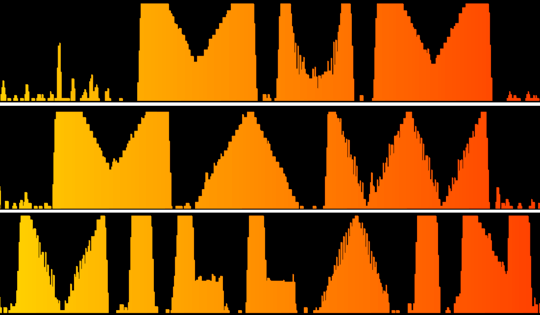
Your goal is simple to tell, but hard to implement. Draw the text MAIL (as it is one of the few words that can be read on a 1D graph) on the CPU graph.
It should look something like this:

Elaborating a bit more on what qualifies:
- The code does not need to be cross-platform (so you won't need unknown APIs to deal with).
- You may capture it in any general CPU usage utility that you have.
- The graph looks a bit worse on a different machine: I trust you this time.
- The base CPU usage % must be continuous, so if you generate a random wave and highlight something that looks like the word MAIL, it's obviously cheating.
- You may choose the maximum load to use, but it has to be substantial enough to clearly see it.
- You must follow the linearity of the example. (For M it looks like this: base %, then sudden increase to the specified max, fall gradually to a lower %, rise back to max and sudden drop to the base % again.)
- If it's unreadable, voters will notice after all.
Standard loopholes apply. Post the images too!







Interesting idea, but this question is about drawing pictures more than anything else. Wasting computer cycles isn't really much of a programming challenge, and art competitions don't belong here. – r3mainer – 2014-07-06T20:52:32.503
2i changed the goal to code-golf so that it can be more challenging and less artistic :) – bebe – 2014-07-06T21:11:45.690
9I don't see a reason for the close vote anymore. I personally find this a fun challenge, albeit a little system specific. – seequ – 2014-07-06T21:22:27.350
Well at least it's original! I like it, might have a go. – tomsmeding – 2014-07-06T21:29:27.813
@bebe that's better – r3mainer – 2014-07-06T21:53:30.910
6The problem I see with code golf is to judge how legible is legible enough. If you can think of a way to specify that objectively, that would greatly improve the challenge, but it's a really nice idea anyway! – Martin Ender – 2014-07-06T22:03:36.960
@m.buettner i'm really thinking but i can't find a solution to check the entries' legibility. maybe fourier series to check the error rate compared to the example... no. i'm trying though. – bebe – 2014-07-06T22:27:26.927
@bebe you could specify the shape a bit more precisely. say: the user may choose the maximum load he's going to use, but it has to be substantial enough to clearly see it. then: have a sudden increase to that maximum, fall gradually off to ~half of that, and then rise back to the maximum at the same rate. sudden drop to 0. then rise gradually to the top, fall off with the same rate to 0. sudden rise to the top, sudden drop to 0. sudden rise to the top, sudden drop to ~one third, sudden drop to 0. – Martin Ender – 2014-07-07T00:54:16.890
3it's really just the same as your picture, but I guarantee you if you don't put it in words, people will interpret "draw MAIL" very liberally. – Martin Ender – 2014-07-07T00:54:58.373
34+1, it is so absurd I almost chuckled myself to death... "this is madness..." "madness.. THIS IS CODEGOLF!!!" – None – 2014-07-07T12:18:49.770
5This is a friggin awesome question. I wish I was smart enough to participate. That doesn't really matter, I'm interested in the creative solutions by other people :P – Chris Cirefice – 2014-07-08T15:25:45.357
1I wonder if a solution could be made to both look and sound good. Close to the end of the last millennium, I wrote a DOS program, that would play a sound with alternating pitch on my sound card without ever sending a byte to the sound card. Instead I just exploited that the sound card was overly sensitive to variations in the current drawn by the CPU. – kasperd – 2014-07-08T15:33:25.400
3The most useless waist of bandwidth ever. – sergiol – 2014-07-14T01:37:51.043