Generate Newton fractals

24

11

You all know the Newton method to approximate the roots of a function, don't you? My goal in this task is to introduce you into an interesting aspect of this algorithm.

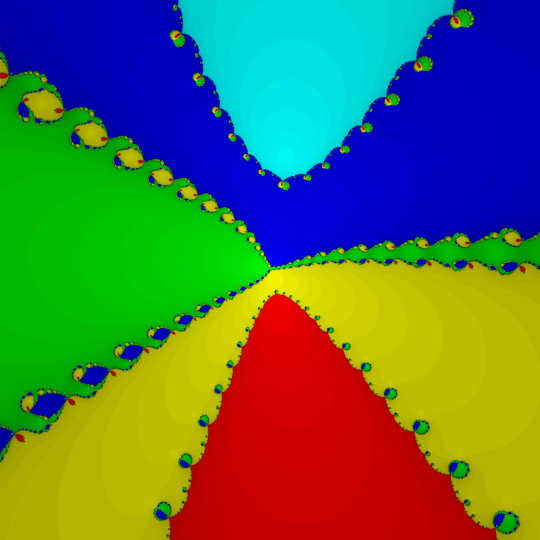
Newton's algorithm converges only for certain, but most of all complex input values. If you picture the convergence of the method for all input values over the complex plane, you usually get a beautiful fractal like this:

Newton fractal for f(x) = x^3-1 Image from Wikimedia commons

Specifications

The goal of this task is, to generate such fractals. This means, that you get a polynomial as the input and have to print out the corresponding fractal as an image in a format of your choice as the output.

Input

The input is a whitespace-separated list of complex numbers. They are written down in the style <Real part><iImaginary part>, like this number: 5.32i3.05. You may assume, that the input number has no more than 4 decimal places and is smaller than 1000. The first of them must not be zero. For example, this could be an input to your program:

1 -2i7.5 23.0004i-3.8 i12 0 5.1233i0.1

The numbers are interpreted as the coefficients of a polynomial, beginning with the highest power. Throughout the rest of this specification, the input polynomial is called P. The above input is equal to this polynomial:

f(x) = x5 + (-2 + 7.5i)x4 + (23.0004 - 3.8i)x3 + 12ix2 + 5.1233 + 0.1i

The input may come to you either from stdin, from an argument passed to the program or from a prompt displayed to your program. You may assume, that the input does not contain any leading or trailing whitespace characters.

Rendering

You have to render the fractal in the following way:

  • Choose as many colors as roots of P plus an extra color for divergence
  • For each number in the visible plane, determine whether the method converges and if yes to which root. Color the point according to the result.
  • Do not print rulers or other fancy things
  • Print a black point at the points, that are the polynomials roots for orientation. You may print up to four pixels around each root.
  • Find a way to choose the visible plane in a way, that all roots are distinguishable and spread widely across it, if possible. Although a perfect placement of the output frame is not required, I reserve the right to refuse to accept an answer that chooses the frame in an unacceptable way, eg. always at the same coordinates, all roots are in one point, etc.
  • The output image should have a size of 1024*1024 pixels.
  • Rendering time is 10 minutes maximum
  • Using single precision floating-point values is enough

Output

The output should be a raster graphics image in a file format of your choice, readable by standard software for a brand X operating system. If you want to use a rare format, consider adding a link to a website where one can download a viewer for it.

Output the file to stdout. If your language does not support putting something to stdout or if you find this option less convenient, find another way. In any way, it must be possible to save the generated image.

Restrictions

  • No image processing libraries
  • No fractal generating libraries
  • The shortest code wins

Extensions

If you like this task, you could try to color the points according to the speed of convergence or some other criteria. I'd like to see some interesting results.

FUZxxl

Posted 2011-05-09T18:16:47.960

Reputation: 9 656

@MartinBüttner Please do not edit parts of the question without knowing why they are the way they are. For instance, I use <pre> instead of four spaces so no syntax highlighting takes place. Also, the question says <Real part><iImaginary part> for a reason because the right format is 1234 instead of 1234i when the imaginary part is missing. – FUZxxl – 2014-12-18T12:08:27.000

@MartinBüttner Sorry, I missed one instance where you corrected to polynomial. Of course, polynomial is the correct word in this case. – FUZxxl – 2014-12-18T14:19:01.790

6I'm not entirely sure whether this is suitable as a code golf. In my eyes the task is way too complex. I may be proven wrong, though. – Joey – 2011-05-09T19:37:50.417

@Joey: It IS complex. But I think a solution takes at most 1500 chars. – FUZxxl – 2011-05-09T19:43:05.057

5@Joey: Indeed. I would like for this to be a [tag:code-challenge] myself. – Joey Adams – 2011-05-09T19:50:20.853

I think 1500chars is on the long side for code-golf. I don't like the time limits, as languages which don't use native floats/ints are severly disadvantaged. eg, Python can be almost 2 orders of magnitude slower than C for the same algorithm (especially with math) – gnibbler – 2011-05-09T21:30:08.150

The requirements are impossible to meet in their full generality. E.g. consider input 1 -1000 0.01 -10. It has roots -0.1, 0.1, 1000. If the x-axis is linear and the output image is 1024 pixels then two of the roots cannot be distinguished. – Peter Taylor – 2011-05-09T21:35:51.547

graphic format is too much, consider 2D array, or is Processing (processing.org ) or HTML5 canvas allowed? – Ming-Tang – 2011-05-09T22:28:53.363

@SHiNKiROU, .bmp and .tga are pretty trivial file formats. – Peter Taylor – 2011-05-09T22:31:27.370

2... or PPM for that matter. – Joey – 2011-05-09T22:51:55.793

1@Joey: My intention was to create a rather difficult task, as many people dislike very easy tasks. – FUZxxl – 2011-05-10T14:29:41.703

Well, Ventero already told me that this strikes the other end of the scale. It also helps to have at least two different reference solutions (usually golfed) to a task to judge its complexity. But that's probably only my own opinion on that :-). The problem with such complex tasks is that you cannot just throw it away and try a different implementation if it takes you an hour or two to write even the first one. While longer solutions offer more places to golf it also makes iterating on an answer more complex and time-consuming which is why I at least don't like too complex tasks too much. – Joey – 2011-05-10T17:01:22.153

1It's easily broken down into separate tasks, and if your language supports complex floating point numbers natively then you can save a large chunk. I have a not-fully-golfed version running at 1600 chars, of which 340 are the complex number class. It doesn't yet identify the roots and use colours, but I'm trying to track down what I presume is a bug in the N-R code. (Finding a root of x^3-1 starting at -0.5+0.866i surely shouldn't diverge!) – Peter Taylor – 2011-05-10T22:06:01.953

"This task is doable in less than 450 characters in more than 3 languages" [Ev's conjecture (: ] – Eelvex – 2011-05-11T01:01:04.720

Can I cheat by using the svg or even html format? (putting full of divs) – Ming-Tang – 2011-05-11T01:53:51.253

@SHiNKiROU: It says "raster graphics", so no vectors. But you may use SVG and embed a raster image. If you plan something interesting, just show me. – FUZxxl – 2011-05-11T05:16:53.867

so I can't draw full of vector squares as pixels – Ming-Tang – 2011-05-11T05:21:42.687

Ah, that's what you mean. If you like just Do it. You could also submit an SVG with embedded javascript as a submission. – FUZxxl – 2011-05-11T07:56:51.260

"0" and "1" are not of the form <Real part>i<Imaginary part>. Neither is "i12" unless the brackets mean "optional". – Jesse Millikan – 2011-05-12T01:08:01.340

1clarified: EIther part may be dropped if zero, but not both. – FUZxxl – 2011-05-12T07:32:13.663

Answers

13

Python, 827 777 chars

import re,random
N=1024
M=N*N
R=range
P=map(lambda x:eval(re.sub('i','+',x)+'j'if 'i'in x else x),raw_input().split())[::-1]
Q=[i*P[i]for i in R(len(P))][1:]
E=lambda p,x:sum(x**k*p[k]for k in R(len(p)))
def Z(x):
 for j in R(99):
  f=E(P,x);g=E(Q,x)
  if abs(f)<1e-9:return x,1
  if abs(x)>1e5or g==0:break
  x-=f/g
 return x,0
T=[]
a=9e9
b=-a
for i in R(999):
 x,f=Z((random.randrange(-9999,9999)+1j*random.randrange(-9999,9999))/99)
 if f:a=min(a,x.real,x.imag);b=max(b,x.real,x.imag);T+=[x]
s=b-a
a,b=a-s/2,b+s/2
s=b-a
C=[[255]*3]*M
H=lambda x,k:int(x.real*k)+87*int(x.imag*k)&255
for i in R(M):
 x,f=Z(a+i%N*s/N+(a+i/N*s/N)*1j)
 if f:C[i]=H(x,99),H(x,57),H(x,76)
for r in T:C[N*int(N*(r.imag-a)/s)+int(N*(r.real-a)/s)]=0,0,0
print'P3',N,N,255
for c in C:print'%d %d %d'%c

Finds display bounds (and roots) by finding convergence points for a bunch of random samples. It then draws the graph by computing the convergence points for each starting point and using a hash function to get randomish colors for each convergence point. Look very closely and you can see the roots marked.

Here's the result for the example polynomial.

result for example polynomial

Keith Randall

Posted 2011-05-09T18:16:47.960

Reputation: 19 865

Good! I like this. – FUZxxl – 2011-05-11T05:18:05.003

14

Java, 1093 1058 1099 1077 chars

public class F{double r,i,a,b;F(double R,double I){r=R;i=I;}F a(F c){return
new F(r+c.r,i+c.i);}F m(F c){return new F(r*c.r-i*c.i,r*c.i+i*c.r);}F
r(){a=r*r+i*i;return new F(-r/a,i/a);}double l(F c){a=r-c.r;b=i-c.i;return
Math.sqrt(a*a+b*b);}public static void main(String[]a){int
n=a.length,i=0,j,x,K=1024,r[]=new int[n];String o="P3\n"+K+" "+K+"\n255 ",s[];F z=new
F(0,0),P[]=new F[n],R[]=new F[n],c,d,e,p,q;for(;i<n;)P[i]=new
F((s=a[i++].split("i"))[0].isEmpty()?0:Float.parseFloat(s[0]),s.length==1?0:Float.parseFloat(s[1]));double
B=Math.pow(P[n-1].m(P[0].r()).l(z)/2,1./n),b,S;for(i=1;i<n;){b=Math.pow(P[i].m(P[i-1].r()).l(z),1./i++);B=b>B?b:B;}S=6*B/K;for(x=0;x<K*K;){e=d=c=new
F(x%K*S-3*B,x++/K*S-3*B);for(j=51;j-->1;){p=P[0];q=p.m(new
F(n-1,0));for(i=1;i<n;){if(i<n-1)q=q.m(c).a(P[i].m(new
F(n-1-i,0)));p=p.m(c).a(P[i++]);}c=c.a(d=q.r().m(p));if(d.l(z)<S/2)break;}i=j>0?0:n;for(;i<n;i++){if(R[i]==null)R[i]=c;if(R[i].l(c)<S)break;}i=java.awt.Color.HSBtoRGB(i*1f/n,j<1||e.l(c)<S&&r[i]++<1?0:1,j*.02f);for(j=0;j++<3;){o+=(i&255)+" ";i>>=8;}System.out.println(o);o="";}}}

Input is command-line arguments - e.g. run java F 1 0 0 -1. Output is to stdout in PPM format (ASCII pixmap).

The scale is chosen using the Fujiwara bound on the absolute value of the complex roots of a polynomial; I then multiply that bound by 1.5. I do adjust brightness by convergence rate, so the roots will be in the brightest patches. Therefore it's logical to use white rather than black to mark the approximate locations of the roots (which is costing me 41 chars for something which can't even be done "correctly". If I label all points which converge to within 0.5 pixels of themselves then some roots come out unlabelled; if I label all points which converge to within 0.6 pixels of themselves then some roots come out labelled over more than one pixel; so for each root I label the first point encountered to converge to within 1 pixel of itself).

Image for the example polynomial (converted to png with the GIMP): Roots of x^5+(-2+7.5i)x^4+(23.0004-3.8i)x^3+12i x^2+(5.1233+0.1i)

Peter Taylor

Posted 2011-05-09T18:16:47.960

Reputation: 41 901

@FUZxxl, the image is from the old version. I'll upload one with the rate of convergence later. But the problem with marking the roots is determining which pixel to mark. It's the classic problem that with floating point you can't use exact equality tests, so you have to compare to an epsilon. As a result, I don't have "canonical" values for the roots. I could mark pixels which converge in one step, but that doesn't guarantee to mark anything, and could mark a block of 4 pixels for a single root. – Peter Taylor – 2011-05-11T14:17:04.377

@Peter Taylor: As you see, Keith Randall also found a solution to that problem. I added this requirement as an extra difficulty. One approach to do it would be to calculate the nearest pixel for each root and then checking each pixel for being equal to it. – FUZxxl – 2011-05-11T15:31:00.943

@FUZxxl, you haven't understood my point. "The nearest pixel" of a root is not well defined. However, I can hack something in which might work for all the test cases you throw at it, and I get the impression that that will make you happy. I'm going to colour it white, not black, because that's more logical. – Peter Taylor – 2011-05-11T15:43:07.577

@Peter Taylor: Okay. – FUZxxl – 2011-05-11T15:46:46.810

@FUZxxl, looking closely, Keith also seems to have multiple pixels labelled for one of the roots. As I say, it's not a feasible task to label "the" correct pixel. – Peter Taylor – 2011-05-11T18:58:05.987

@Peter Taylor: Umph... okay I am going to change the requirements: It is allowed to color up to for pixels around the roots. – FUZxxl – 2011-05-11T19:27:59.880

6My profile pic should soon change to x^6-9x^3+8, carefully designed by choosing the roots and then using Wolfram Alpha to simplify the polynomial. Ok, I cheated by swapping the hues around afterwards in the GIMP. – Peter Taylor – 2011-05-11T22:55:35.653

3

Python, 633 bytes

import numpy as np
import matplotlib.pyplot as plt
from colorsys import hls_to_rgb
def f(z):
    return (z**4 - 1)
def df(z):
    return (4*z**3) 
def cz(z):
    r = np.abs(z)
    arg = np.angle(z)   
    h = (arg + np.pi)  / (3 * np.pi)
    l = 1.0 - 1.0/(1.0 + r**0.1)
    s = 0.8 
    c = np.vectorize(hls_to_rgb) (h,l,s)
    c = np.array(c)
    c = c.swapaxes(0,2) 
    return c    
x, y = np.ogrid[-1.5:1.5:2001j, -1.5:1.5:2001j]
z = x + 1j*y    
for i in range(10):
    z -= (f(z) / df(z))
zz = z
zz[np.isnan(zz)]=0
zz=cz(zz)
plt.figure()
plt.imshow(zz, interpolation='nearest')
plt.axis('off')
plt.savefig('plots/nf.svg')
plt.close()

After Speed Ups and Beautification (756 bytes)

import numpy as np
from numba import jit
import matplotlib.pyplot as plt
from colorsys import hls_to_rgb 

@jit(nopython=True, parallel=True, nogil=True)
def f(z):
    return (z**4 - 1)   

@jit(nopython=True, parallel=True, nogil=True)
def df(z):
    return (4*z**3) 

def cz(z):
    r = np.abs(z)
    arg = np.angle(z)   

    h = (arg + np.pi)  / (3 * np.pi)
    l = 1.0 - 1.0/(1.0 + r**0.1)
    s = 0.8 

    c = np.vectorize(hls_to_rgb) (h,l,s)
    c = np.array(c)
    c = c.swapaxes(0,2) 
    return c    

x, y = np.ogrid[-1.5:1.5:2001j, -1.5:1.5:2001j]
z = x + 1j*y    

for i in range(10):
    z -= (f(z) / df(z))

zz = z
zz[np.isnan(zz)]=0
zz=cz(zz)
plt.figure()
plt.imshow(zz, interpolation='nearest')
plt.axis('off')
plt.savefig('plots/nf.svg')
plt.close()

The plot below is for Newton Fractal of log(z) function.

Newton Fractal for log(z)

Cheesebread

Posted 2011-05-09T18:16:47.960

Reputation: 31

You can use shorter (1 char) names and remove whitespace by combining multiple lines using ;. Also, remove all the spaces possible. – mbomb007 – 2018-04-06T20:07:10.933

Some regular golfs reduce this to just 353 bytes! Haven't tested it (no matplotlib here), so no guarantee that it still works.

– Khuldraeseth na'Barya – 2018-04-06T20:32:58.190