Animated drawing of a Bézier curve

39

15

Your job is to draw a Bézier curve given it's control points. The only criteria is that you actually have to show how to draw the curve from the initial control point to the last one.

Criterias

  • The result has to be animated, e.g. it has to show the drawing process somehow. The way you do the animation is irrelevant, it can generate a .gif, it can draw to a window, or generate ASCII results (and possibly clearing the screen after each draw), etc.
  • It has to support at least 64 control points.
  • This is a popularity contest, so you might want to add some additional features to your program to get more upvotes. (My answer for example draws the control points, and some visual aid on how to generate the image as well)
  • The winner is the most upvoted valid answer 7 days after the last valid submission.
  • My submission doesn't count as valid.

How to draw a Bézier curve

Assume we want to draw 100 iterations. To get the nth point of the curve you can use the following algorithm:

1. Take each adjanced control point, and draw a line between them
2. Divide this line by the number of iterations, and get the nth point based on this division.
3. Put the points you've got into a separate list. Let's call them "secondary" control points.
4. Repeat the whole process, but use these new "secondary" control points. As these points have one less points at each iteration eventually only one point will remain, and you can end the loop.
5. This will be nth point of the Bézier curve

This might be a bit hard to understand when written down, so here are some images to help visualize it:

For two control points (shown in black dots) you only have one line initally (the black line). Dividing this line by the number of iterations and getting the nth point will result in the next point of the curve (shown in red):

Two points

For three control points, you first have to divide the line between the first and the second control point, then divide the line between the second and third control point. You will get the points marked with blue dots.

Then, as you still have two points, you have to draw a line between these two points (blue in the image), and divide them again to get the next point for the curve:

Three points

As you add more control points the algorithm stays the same, but there will be more and more iterations to do. Here is how it would look like with four points:

Four points

And five points:

Five points

You can also check my solution, which was used to generate these images, or read more about generating Bézier curves at Wikipedia

SztupY

Posted 2014-02-17T18:41:33.367

Reputation: 3 639

"It has to support at least 64 control points." Isn't this excessive? I would think that 6 control points would be enough. – DavidC – 2014-02-17T20:49:51.353

@DavidCarraher: the algorithm isn't that hard to implement, and it runs in O(n^2) time and space (where n is the number of control points), so 64 shouldn't be that excessive (and the results can be really cool with lots of control points). Of course if there is an actual technical limitation with a chosen language that makes it impossible / very impractical to solve this with more than a few degrees, then I'm happy to decrease it. – SztupY – 2014-02-17T21:36:56.380

1A nice variation, instead of going backwards or endlessly repeating. At the end drop the first point and choose another random point. Keep extending the line. – QuentinUK – 2014-02-23T11:56:31.123

Answers

18

Done recursively in Mathematica with no hard limits on the number control points in just three lines:

ctrlPts = {{0, 0}, {1, 1}, {2, 0}, {1, -1}, {0, 0}};
getLines[x_List] := Partition[x, 2, 1];
partLine[{a_, b_}, t_] := t a + (1 - t) b;
f[pts_, t_] := NestList[partLine[#, t] & /@ getLines@# &, pts, Length@pts- 1]

Showing it is more involved than the calculations!:

color[x_] := ColorData[5, "ColorList"][[x[[1]]]]
Animate[Graphics[{PointSize[.03], ,
        MapIndexed[{color@#2, Point/@ #1,Line@#1} &, f[ctrlPts,t]],
        Red, Point@Last@f[ctrlPts, t],
        Line@Flatten[(Last@f[ctrlPts, #]) & /@ Range[0, t, 1/50], 1]}], {t, 0, 1}]

Code dissection (kind of) for the calc part:

getLines[x_List] := Partition[x, 2, 1]; (* Takes a list of points { pt1, pt2, pt...} 
                                           as input and returns {{pt1,pt2}, {pt2,pt3} ...}
                                           which are the endpoints for the successive
                                           lines between the input points *)

partLine[{a_, b_}, t_] := t a + (1 - t) b;(* Takes two points and a "time" as input 
                                             and calculates
                                             a linear interpolation between them*)

f[pts_, t_] := NestList[partLine[#, t] & /@ getLines@# &, pts, Length@pts- 1]
                                          (* This is where the meat is :) 
     Takes a list of n points and a "time" as input.
     Operates recursively on the previous result n-1 times, preserving all the results 
     Each time it does the following with the list {pt1, pt2, pt3 ...} received:
           1) Generates a list {{pt1, pt2}, {pt2, pt3}, {pt3, pt4} ...}
           2) For each of those sublists calculate the linear interpolation at time "t",
              thus effectively reducing the number of input points by 1 in each round.
     So the end result is a list of lists resembling:
     {{pt1, pt2, pt3 ...}, {t*pt1+(1-t)*pt2, t*pt2+(1-t)*pt3,..}, {t*pt12+(1-t)*pt23, ..},..}
                             --------------   ---------------         
                                  pt12              pt23
     And all those are the points you see in the following image:

enter image description here

With a few more lines you can drag the control points interactively while the animation is running:

Manipulate[
 Animate[Graphics[{
    PointSize[.03], Point@pts,
    MapIndexed[{color@#2, Point /@ #1, Line@#1} &, f[pts, t]],
    Red, Point@Last@f[pts, t], Line@Flatten[(Last@f[pts, #]) & /@ Range[0, t, 1/50], 1]}, 
   PlotRange -> {{0, 2}, {-1, 1}}], {t, 0, 1}],
  {{pts, ctrlPts}, Locator}]

Here dragging the green point:

enter image description here

BTW, the same code runs in 3D without modifications (For the Mathematica geeks you only have to replace Graphics[] by Graphics3D[] and add a third coordinate to the control points list):

enter image description here

NB:

Of course this kludge isn't needed in Mathematica as there are several primitives for drawing Beziers:

Graphics[{BSplineCurve[ctrlPts], Green, Line[ctrlPts], Red,  Point[ctrlPts]}]

Mathematica graphics

Dr. belisarius

Posted 2014-02-17T18:41:33.367

Reputation: 5 345

4it's nice to see a mathematica solution that doesn't heavily rely on its huge library – izabera – 2014-02-20T02:38:46.187

3Instructions for testing this answer without Mathematica installed: 1) Download http://pastebin.com/qU9rztdf and save it as *.CDF 2) Dowload the free CDF environment from Wolfram Research at https://www.wolfram.com/cdf-player/ (not a small file) 3) "Alt + Left-Click" on Windows or "CMD + Left-Click" on Mac for creating/deleting control points 4) Control points can also be dragged! – Dr. belisarius – 2014-02-20T17:26:16.750

15

Python

Certainly not the most efficient or beautiful code but it was fun to write. Run as

$> python thisscript.py

The control points are randomly generated for now but it is trivial to extend it to allow for stdin or file input.

  • Shows the control points
  • Shows the iterations
  • Different color for each iteration

As a bonus there is an endless mode that is guaranteed to provide for entertainment for hours if not days!

Matplotlib is required and ImageMagick if you want to save the resulting GIF. Tested up to 64 control points (runs very slow with a large number of points!)

An example output gif

import matplotlib
matplotlib.use('GTkAgg')
import pylab as pl
from math import sin,cos,pi
from random import random
import os
import time

class Point:
    def __init__(self,x,y):
        self.x=x
        self.y=y
    def __repr__(self):
        return "[{:.3f},{:.3f}]".format(self.x,self.y)
    def __str__(self):
        return self.__repr__()

class Path:
    def __init__(self,points):
        self.points=points
    def interpolate(self,u): # interpolate the path, resulting in another path with one point less in length
        pts = [None]*(len(self.points)-1)
        for i in range(1,len(self.points)):
            x = self.points[i-1].x + u*( self.points[i].x - self.points[i-1].x)
            if (self.points[i-1].x == self.points[i].x): # vertical line
                y = self.points[i-1].y + u*( self.points[i].y - self.points[i-1].y)
            else:
                y = self.points[i-1].y + (self.points[i].y - self.points[i-1].y)/(self.points[i].x - self.points[i-1].x)*( x - self.points[i-1].x)
            pts[i-1] = Point(x,y)
        return Path(pts)

    def interpolate_all(self,u): # interpolate all the paths
        paths = [None]*len(self.points)
        paths[0]=self
        for i in range(1,len(paths)):
            paths[i] = paths[i-1].interpolate(u)
        return paths

    def draw(self,ax,color,*args,**kwargs):
        x = [ p.x for p in self.points]
        y = [ p.y for p in self.points]
        ax.plot(x,y,*args,color=color,**kwargs)
        ax.scatter([p.x for p in self.points], [p.y for p in self.points],color=color)  

    def __str__(self):
        return str(self.points)

def bezier(path,ustep,ax,makeGif):
    if makeGif:
        os.system("mkdir -p tempgif")
    u=0.
    x=[] # x coordinate list for the bezier path point
    y=[] # y coordinate list for the bezier path point
    pl.ion()
    pl.show()
    n=0
    while u < 1.+ustep: # and not u <= 1.0 to get rid of rounding errors 
        ax.cla()
        paths = path.interpolate_all(u)
        x.append(paths[-1].points[0].x)
        y.append(paths[-1].points[0].y)
        u+=ustep
        for i in range(len(paths)):
            color = pl.cm.jet(1.*i/len(paths)) # <-- change colormap here for other colors, for a list of available maps go to http://wiki.scipy.org/Cookbook/Matplotlib/Show_colormaps
            paths[i].draw(ax,color=color,lw=2) # draw all the paths
        ax.plot(x,y,color='red',lw=5) # draw the bezier curve itself
        pl.draw()
        if makeGif:
            pl.savefig("tempgif/bezier_{:05d}.png".format(n))
            n+=1
    if makeGif:
        print("Creating your GIF, this can take a while...")
        os.system("convert -delay 5 -loop 0 tempgif/*.png "+makeGif)
        os.system("rm -r tempgif/")
        print("Done.")
    pl.ioff()

def getPtsOnCircle(R,n):
    x = [None]*(n+1)
    y = [None]*(n+1)
    for i in range(n+1):
        x[i] = R*cos(i*2.*pi/n)
        y[i] = R*sin(i*2.*pi/n)
    return x,y

def getRndPts(n):
    x = [ random() for i in range(n) ]
    y = [ random() for i in range(n) ]
    return x,y

def run(ax,x,y,makeGif=False):
    ctrlpoints = [ Point(px,py) for px,py in zip(x,y) ]
    path = Path(ctrlpoints)
    bezier(path,0.01,ax,makeGif) # 0.01 is the step size in the interval [0,1]

def endless_mode(ax):
    while True:
        x,y = getRndPts( int(5+random()*10) )
        run(ax,x,y)
        pl.draw()
        time.sleep(0.5) # pause for a moment to gaze upon the finished bezier curve
def main():
    fig = pl.figure(figsize=(6,6)) # <-- adjust here for figure size
    fig.subplots_adjust(0,0,1,1)
    ax = fig.add_subplot(111)
    ax.get_xaxis().set_visible(False)
    ax.get_yaxis().set_visible(False)
    opt = raw_input("[s]ingle run or [e]ndless mode? ")
    if opt=='s':
        gifname = raw_input("Name of output GIF (leave blank for no GIF): ")
        x,y = getRndPts(15)
        run(ax,x,y,gifname if gifname != "" else False)
        pl.show()
    elif opt=='e':
        endless_mode(ax)
    else:
        print("Invalid input: "+opt)

main()

camelthemammel

Posted 2014-02-17T18:41:33.367

Reputation: 346

That was impressive. A note for others: PyGTK is only available for 2.6 and 2.7. And although not stated anywhere, the installed version of GTK+ on your system most visible to your python interpreter must be 2.x.

– primo – 2014-02-20T12:02:38.780

11

Postscript

to generate a gif, make sure 'emitpages' is defined as true, and:

gs -sDEVICE=png16 -g500x500 -o bezan%03d.png bezanim.ps
convert bezan*.png bezan.gif

extra features:

  • configurable bounding box
  • 2 generators: random points, randomly permuted random flattened Bezier
  • "overlay" animation (where it doesn't erase anything).
  • optional 'showpage' (use for generating gifs, omit for on-screen preview)

Using ghostscript and larger sets of points, the on-screen preview is very different from the generated images, as you can watch the lines "converge" upon each point.

simple set of points, scaled, using png48:

simple point set

simple set with overlay:

simple set with overlay

lots of points, overlay animation:

overlay animation

non-overlay:

non-overlay

code:

%!
/iterations 100 def
%/Xdim 612 def
%/Ydim 792 def
/Xdim 400 def
/Ydim 400 def
/scalepage {
    100 100 translate
    %1 5 scale % "tron"?
    1 3 dup dup scale div currentlinewidth mul setlinewidth
} def scalepage
/gen 2 def  % 0:rand points  1:rand permuted bezier
            % 2:special list
/genN 6 def % number of generated points
/overlay true def
/emitpages false def
/emitpartials false def
/.setlanguagelevel where { pop 2 .setlanguagelevel } if

/pairs { % array-of-points  .  array-of-pairs-of-points
    [ exch 0 1 2 index length 2 sub { % A i
        2 copy 2 getinterval % A i A_[i..i+1]
        3 1 roll pop % A_[i..i+1] A
    } for pop ]
} def

/drawpairs {
    gsave
    dup 1 exch length B length div sub setgray
    {
        aload pop
        aload pop moveto
        aload pop lineto
        stroke
        %flushpage
    } forall
    %flushpage
    %emitpartials { copypage } if
    grestore
} def

/points { % array-of-pairs  .  array-of-points
    [ exch { % pair
        [ exch
        aload pop % p0 p1
        aload pop 3 2 roll aload pop % p1x p1y p0x p0y
        exch % p1x p1y p0y p0x
        4 3 roll % p1y p0y p0x p1x
        exch % p1y p0y p1x p0x
        2 copy sub n mul add exch pop % p1y p0y p0x+n(p1x-p0x)
        3 1 roll % p0x+n(p1x-p0x) p1y p0y
        2 copy sub n mul add exch pop % p0x+n(p1x-p0x) p0y+n(p1y-p0y)
        ]
    } forall ]
} def

/drawpoints {
    gsave
    dup length B length div setgray
    {
        newpath
        aload pop 2 copy moveto currentlinewidth 3 mul 0 360 arc fill
        %flushpage
    } forall
    %flushpage
    emitpartials { copypage } if
    grestore
} def

/anim {
    /B exch def
    /N exch def
    /Bp B pairs def
    Bp drawpairs
    1 0 0 setrgbcolor
    B 0 get aload pop moveto
    0 1 N div 1 { /n exch def
        B
        {
            dup length 1 eq { exit } if
            dup drawpoints
            pairs dup drawpairs
            points
        } loop
        aload pop
        aload pop
        2 copy
        gsave
            newpath
            2 copy moveto currentlinewidth 3 mul 0 360 arc fill
        grestore
        lineto currentpoint stroke 2 copy moveto
        gsave
            count dup 1 add copy
            3 1 roll moveto
            2 idiv 1 sub {
                lineto
            } repeat
            pop
            stroke
        grestore
        emitpages {
            currentpoint
            currentrgbcolor
            overlay { copypage }{ showpage scalepage } ifelse
            setrgbcolor
            moveto
        }{
            flushpage 10000 { 239587 23984 div pop } repeat 
            flushpage 4000 { 239587 23984 div pop } repeat
            overlay not {
                erasepage Bp drawpairs
            } if
            %flushpage
        } ifelse
    } for
    moveto N { lineto } repeat stroke
} def

% "main":

iterations
[
    { [ genN { [ rand Xdim mod rand Ydim mod ] } repeat ] }
    {
        40 setflat
        rand Xdim mod rand Ydim mod moveto
        genN 1 sub 3 div ceiling cvi
            { 3 { rand Xdim mod rand Ydim mod } repeat curveto } repeat
        flattenpath
        [{2 array astore}dup{}{}pathforall]
        [exch dup 0 get exch 1 1 index length 1 sub getinterval {
            rand 2 mod 0 eq { exch } if
        } forall]
        0 genN getinterval
    }
    {
        [
            [10 10]
            [100 10]
            [100 100]
            [10 100]
            [10 40]
            [100 40]
            [130 10]
            [50 50]
            [80 50]
            [110 30]
            [20 50]
            [70 50]
            [60 50]
            [10 10]
            [40 50]
            [30 50]
            [10 30]
            [90 50]
            [10 50]
            [120 20]
            [10 20]
        ] 0 genN getinterval
    }
] gen get exec

newpath anim

stroke

luser droog

Posted 2014-02-17T18:41:33.367

Reputation: 4 535

The overlay animation looks like a modern art dragon – SztupY – 2014-02-20T23:03:23.167

It is pretty wild! When previewing with ghostscript, the erases were very difficult to watch because of the stroboscopic effect, so I tried removing them. But even with the overlay, the ghostscript preview is still very "flashy". Perhaps not suitable for epileptics. :( – luser droog – 2014-02-21T05:12:43.423

You should add a few images with less control points. It's fairly hard to see what's going on. – primo – 2014-02-21T05:24:39.810

Yes. good idea. – luser droog – 2014-02-21T05:25:07.610

9

Ruby + RMagick

Additional features:

  • Shows the control points
  • Shows each iteration
  • Uses different colours for each iteration

To use send the points from STDIN:

$ echo "300 400 400 300 300 100 100 100 200 400" | ./draw.rb

Result will be inside result.gif:

Five points

Here is another run, with 12+1 points:

$ echo "100 100 200 200 300 100 400 200 300 300 400 400 300 500 200 400 100 500 0   400 100 300 0   200 100 100" | ./draw.rb

Thirteen points

Code

This is neither golfed, nor too readable, sorry for that.

draw.rb

#!/usr/bin/env ruby
require 'rubygems'
require 'bundler/setup'
Bundler.require(:default)

ITERATIONS = 100

points = ARGF.read.split.map(&:to_i).each_slice(2).to_a
result = []

def draw_line(draw,points)
  points.each_cons(2) do |a,b|
    draw.line(*a, *b)
  end
end

def draw_dots(draw,points,r)
  points.each do |x,y|
    draw.ellipse(x,y,r,r,0,360)
  end
end

canvas = Magick::ImageList.new

0.upto(ITERATIONS) do |i|
  canvas.new_image(512, 512)

  draw = Magick::Draw.new

  draw.stroke('black')
  draw.stroke_width(points.length.to_f/2)
  draw_line(draw,points)
  draw_dots(draw,points,points.length)

  it = points.dup
  while it.length>1
    next_it = []
    it.each_cons(2) do |a,b|
      next_it << [b[0]+(a[0]-b[0]).to_f/ITERATIONS * i, b[1]+(a[1]-b[1]).to_f/ITERATIONS * i]
    end
    draw.stroke("hsl(#{360/points.length.to_f*next_it.length},100,100)")
    draw.fill("hsl(#{360/points.length.to_f*next_it.length},100,100)")
    draw.stroke_width(next_it.length.to_f/2)
    draw_line(draw,next_it)
    draw_dots(draw,next_it,next_it.length)
    it = next_it
  end

  result << it.first

  draw.stroke("hsl(0,100,100)")
  draw.fill("hsl(0,100,100)")
  draw.stroke_width(points.length)
  draw_line(draw,result)
  draw_dots(draw,[it.first],points.length*2)

  draw.draw(canvas)
end

canvas.write('result.gif')

Gemfile

source "https://rubygems.org"
gem 'rmagick', '2.13.2'

SztupY

Posted 2014-02-17T18:41:33.367

Reputation: 3 639

8

Java

Using the adaptive subdivision algorithm of Anti Grain Geometry.

Code is interactive and allows the user to drag the four nodes with the mouse.

public class SplineAnimation extends JPanel implements ActionListener, MouseInputListener {
    int     CANVAS_SIZE             = 512;
    double  m_distance_tolerance    = 1;
    double  m_angle_tolerance       = 1;
    int     curve_recursion_limit   = 1000;

    public static void main(String[] args) {
        JFrame f = new JFrame();
        f.setDefaultCloseOperation(JFrame.EXIT_ON_CLOSE);

        f.setContentPane(new SplineAnimation());

        f.pack();
        f.setResizable(false);
        f.setLocationRelativeTo(null);
        f.setVisible(true);
    }

    // Graphics.
    BufferedImage   im      = new BufferedImage(CANVAS_SIZE, CANVAS_SIZE, BufferedImage.TYPE_INT_ARGB);
    Graphics2D      imageG  = im.createGraphics();
    Graphics2D      g       = null;
    Ellipse2D       dot     = new Ellipse2D.Double();
    Line2D          line    = new Line2D.Double();
    Path2D          path    = new Path2D.Double();

    // State.
    Point2D[]       pts     = {new Point2D.Double(10, 10), new Point2D.Double(CANVAS_SIZE / 8, CANVAS_SIZE - 10), new Point2D.Double(CANVAS_SIZE - 10, CANVAS_SIZE - 10), new Point2D.Double(CANVAS_SIZE / 2, 10)};
    double          phase   = 0;
    private int     dragPt;
    private double  f;
    private int     n       = 0;

    public SplineAnimation() {
        super(null);
        setPreferredSize(new Dimension(CANVAS_SIZE, CANVAS_SIZE));
        setOpaque(false);

        // Prepare stuff.
        imageG.setRenderingHint(RenderingHints.KEY_ANTIALIASING, RenderingHints.VALUE_ANTIALIAS_ON);
        imageG.setRenderingHint(RenderingHints.KEY_RENDERING, RenderingHints.VALUE_RENDER_QUALITY);
        imageG.setRenderingHint(RenderingHints.KEY_FRACTIONALMETRICS, RenderingHints.VALUE_FRACTIONALMETRICS_ON);
        imageG.setRenderingHint(RenderingHints.KEY_ALPHA_INTERPOLATION, RenderingHints.VALUE_ALPHA_INTERPOLATION_QUALITY);
        imageG.setRenderingHint(RenderingHints.KEY_STROKE_CONTROL, RenderingHints.VALUE_STROKE_PURE);
        imageG.setStroke(new BasicStroke(1, BasicStroke.CAP_ROUND, BasicStroke.JOIN_ROUND));
        imageG.translate(0.5, 0.5);
        addMouseListener(this);
        addMouseMotionListener(this);

        // Animate!
        new javax.swing.Timer(16, this).start();
    }

    @Override
    public void paintComponent(Graphics g) {
        this.g = (Graphics2D)getGraphics();
    }

    @Override
    public void actionPerformed(ActionEvent e) {
        // Drawable yet?
        if (g == null)
            return;

        // Clear.
        imageG.setColor(Color.WHITE);
        imageG.fillRect(0, 0, CANVAS_SIZE + 1, CANVAS_SIZE + 1);

        // Update state.
        f = 0.5 - 0.495 * Math.cos(phase += Math.PI / 100);

        // Render.
        path.reset();
        path.moveTo(pts[0].getX(), pts[0].getY());
        recursive_bezier(0, pts[0].getX(), pts[0].getY(), pts[1].getX(), pts[1].getY(), pts[2].getX(), pts[2].getY(), pts[3].getX(), pts[3].getY());
        path.lineTo(pts[3].getX(), pts[3].getY());

        imageG.setPaint(Color.BLACK);
        imageG.draw(path);
        g.drawImage(im, 0, 0, null);

//      if (phase > Math.PI)
//          System.exit(0);
//      save("Bezier" + n++ + ".png");
    }

    private void save(String filename) {
        paint(im.getGraphics());
        try {
            ImageIO.write(im, "PNG", new File(filename));
        }
        catch (IOException e) {}
    }

    // Modified algorithm from Anti Grain Geometry.
    // http://www.antigrain.com/research/adaptive_bezier/index.html
    private void recursive_bezier(int level, double x1, double y1, double x2, double y2, double x3, double y3, double x4,
            double y4) {
        if (level > curve_recursion_limit)
            return;

        // Calculate all the mid-points of the line segments
        // ----------------------
        double x12 = x1 + (x2 - x1) * f;
        double y12 = y1 + (y2 - y1) * f;
        double x23 = x2 + (x3 - x2) * f;
        double y23 = y2 + (y3 - y2) * f;
        double x34 = x3 + (x4 - x3) * f;
        double y34 = y3 + (y4 - y3) * f;
        double x123 = x12 + (x23 - x12) * f;
        double y123 = y12 + (y23 - y12) * f;
        double x234 = x23 + (x34 - x23) * f;
        double y234 = y23 + (y34 - y23) * f;
        double x1234 = x123 + (x234 - x123) * f;
        double y1234 = y123 + (y234 - y123) * f;

        if (level > 0) // Enforce subdivision first time
        {
            // Try to approximate the full cubic curve by a single straight line
            // ------------------
            double dx = x4 - x1;
            double dy = y4 - y1;

            double d2 = Math.abs((x2 - x4) * dy - (y2 - y4) * dx);
            double d3 = Math.abs((x3 - x4) * dy - (y3 - y4) * dx);

            double da1, da2;

            if ((d2 + d3) * (d2 + d3) <= m_distance_tolerance * (dx * dx + dy * dy)) {
                // If the curvature doesn't exceed the distance_tolerance
                // value we tend to finish subdivisions.
                // ----------------------

                // Angle & Cusp Condition
                // ----------------------
                double a23 = Math.atan2(y3 - y2, x3 - x2);
                da1 = Math.abs(a23 - Math.atan2(y2 - y1, x2 - x1));
                da2 = Math.abs(Math.atan2(y4 - y3, x4 - x3) - a23);
                if (da1 >= Math.PI)
                    da1 = 2 * Math.PI - da1;
                if (da2 >= Math.PI)
                    da2 = 2 * Math.PI - da2;

                if (da1 + da2 < m_angle_tolerance) {
                    // Finally we can stop the recursion
                    // ----------------------
                    path.lineTo(x1234, y1234);
                    return;
                }
            }
        }

        // Continue subdivision
        // ----------------------
        recursive_bezier(level + 1, x1, y1, x12, y12, x123, y123, x1234, y1234);
        recursive_bezier(level + 1, x1234, y1234, x234, y234, x34, y34, x4, y4);

        // Draw the frame.
        float c = 1 - (float)Math.pow(1 - Math.sqrt(Math.min(f, 1 - f)), level * 0.2);
        imageG.setPaint(new Color(1, c, c));
        line.setLine(x1, y1, x2, y2);
        imageG.draw(line);
        line.setLine(x2, y2, x3, y3);
        imageG.draw(line);
        line.setLine(x3, y3, x4, y4);
        imageG.draw(line);
        line.setLine(x12, y12, x23, y23);
        imageG.draw(line);
        line.setLine(x23, y23, x34, y34);
        imageG.draw(line);
        node(level + 1, x1234, y1234, level == 0? Color.BLUE : Color.GRAY);
    }

    private void node(int level, double x, double y, Color color) {
        double r = 20 * Math.pow(0.8, level);
        double r2 = r / 2;
        dot.setFrame(x - r2, y - r2, r, r);
        imageG.setPaint(color);
        imageG.fill(dot);
    }

    @Override
    public void mouseClicked(MouseEvent e) {}

    @Override
    public void mouseEntered(MouseEvent e) {}

    @Override
    public void mouseExited(MouseEvent e) {}

    @Override
    public void mousePressed(MouseEvent e) {
        Point mouse = e.getPoint();

        // Find the closest point;
        double minDist = Double.MAX_VALUE;
        for (int i = 0; i < pts.length; i++) {
            double dist = mouse.distanceSq(pts[i]);
            if (minDist > dist) {
                minDist = dist;
                dragPt = i;
            }
        }
    }

    @Override
    public void mouseReleased(MouseEvent e) {}

    @Override
    public void mouseDragged(MouseEvent e) {
        pts[dragPt] = e.getPoint();
    }

    @Override
    public void mouseMoved(MouseEvent e) {}
}

enter image description here

Mark Jeronimus

Posted 2014-02-17T18:41:33.367

Reputation: 6 451

HOLYSHIT! That's awesome. +1 – luser droog – 2014-02-27T07:01:45.370

6

HTML5 + Javascript + CSS

So I did it long time ago (the last modified date of the file was 9/21/2012). Glad that I kept it. Unfortunately it only supports 4 control points in its current state, but I'm working on it.

EDIT: Although the UI only supports 4 control points, the underlying function (animateConstruction) does support an arbitrary number of control points. Though I would not suggest doing it for more than 10 since the code is VERY inefficient. (I tried with 25 and had to kill the tab using Task Manager) If this counts as a valid submission I am not planning on revising the code.

NOTE: I was a naive hobbyist back then. The code is wrong on so many levels (including lack of semicolons and use of eval).

To Use

Save the code as a .html file and open it in Google Chrome or JSfiddle
If you need 4 or less control points, enter the parameters on the right, then choose "Construction mode" and press "Animate" in bottom left.
If you need more control points, call the animateConstruction function. It takes an array of coordinates (2-item arrays) as the argument. (e.g. animateConstruction([[0,0],[500,0],[0,500]]). Note that the draw area is 500x500, and the coordinate system follow the HTML canvas element (origin at top-left, x-axis pointing right, y-axis pointing down)
For the fiddle, I have added a text box bottom-left. Enter semicolon-separated coordinates (default value is an example) and press Go.

Differences in Fiddle version

  • The textbox
  • Default animation steps reduced to 100
  • Secondary curves are off by default

Code

<html>
<head>
<style>
span.h{
    display: inline-block;
    text-align: center;
    text-decoration: underline;
    font: bold 1em Arial;
}

input[type="color"]{
    -webkit-appearance: button-bevel;
    vertical-align: -7px;
    width: 21px;
    height: 27px;
}

input[type="color"][disabled]{background: #FFF}

td{position:relative; padding:1px; text-align:center}
table[class] td{text-align:left}
td.t{padding:1px 5px; width:46px;}
table input[type="checkbox"]{visibility:hidden}
tr:hover input[type="checkbox"]{visibility:visible}
</style>
<script type='text/javascript'>
function Bezier(c){
    if(c.length==2) return function(t){return [c[0][0]+t*(c[1][0]-c[0][0]),c[0][1]+t*(c[1][1]-c[0][1])]}
    else return function(t){return Bezier([Bezier(c.slice(0,-1))(t),Bezier(c.slice(1))(t)])(t)}
}

function Bezier2(f1,f2){
    return function(t){return Bezier([f1(t),f2(t)])(t)}
}

//============================================
var c = null
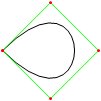
var settings = {'guide':{'show':[true,true,true,true], 'color':['#EEEEEE','#00FF00','#0000FF','#FF00FF'], 'width':[10,1,1,1]}, 'curve':{'show':[true,true,true,true], 'color':['#EEEEEE','#00FF00','#0000FF','#FF00FF'], 'width':[10,3,3,3]}, 'main':{'show':true, 'color':'#FF0000', 'width':10}, 'sample': 100, 'steps':200, 'stepTime':10, 'mode':'Bezier', 'coords':[[0,500],[125,450],[125,0],[500,0]]}
var itv = 0

window.addEventListener('load',function(){
    c = $('c').getContext('2d')
    c.lineCap = 'round'
    c.lineJoin = 'round'
    draw(settings.coords,1)
},true)

function get(k,i){
    var t = settings
    if(k.constructor == Array) k.forEach(function(e){t = t[e]})
    return t.length>i ? t[i] : t.slice(-1)[0]
}

function frame(coords){
    c.strokeStyle = settings.curve.color[0]
    c.lineWidth = settings.guide.width[0]
    c.beginPath()
    c.moveTo.apply(c,coords[0])
    coords.slice(1).forEach(function(e){c.lineTo.apply(c,e)})
    c.stroke()
}

function transf(c){
    var t = []
    c.forEach(function(e){t.push([e[0]+5,e[1]+5])})
    return t
}
//============================================
function drawBezier(coords,t){
    if(t===undefined) t = 1
    coords = transf(coords)
    c.clearRect(0,0,510,510)
    frame(coords)
    c.beginPath()
    c.strokeStyle = settings.main.color
    c.lineWidth = settings.main.width
    c.moveTo.apply(c,coords[0])
    for(var i=0;i<=t*settings.sample;i++) c.lineTo.apply(c,Bezier(coords)(i/settings.sample))
    c.stroke()
}

function animateBezier(coords){
    var s = settings.steps
    var cur = ($('t').value==1 ? ($('t').value=$('T').innerHTML=(0).toFixed(3))*1 : $('t').value*s)+1
    var b = drawBezier(coords,$('t').value*1)
    itv = setInterval(function(){
        $("T").innerHTML = ($("t").value = cur/s).toFixed(3)
        drawBezier(coords,cur++/s,b)
        if(cur>s) clearInterval(itv)
    },settings.stepTime)
}
//============================================
function drawBezier2(coords,t){
    if(t===undefined) t = 1
    c.beginPath()
    c.strokeStyle = get(['curve','color'],coords.length-1)
    c.lineWidth = get(['curve','width'],coords.length-1)
    c.moveTo.apply(c,coords[0])
    for(var i=0;i<=t*100;i++) c.lineTo.apply(c,Bezier(coords)(i/100))
    c.stroke()
}

function drawConstruction(coords,t,B){
    coords = transf(coords)
    if(t===undefined) t = 0.5
    var b = B===undefined ? [[]] : B
    coords.forEach(function(e){b[0].push(function(t){return e})})
    c.clearRect(0,0,510,510)
    frame(coords)
    for(var i=1;i<coords.length;i++){
        if(B===undefined) b.push([])
        with(c){
            for(var j=0;j<coords.length-i;j++){
                if(B===undefined) b[i].push(Bezier2(b[i-1][j],b[i-1][j+1]))
                if(i!=coords.length-1 && get(['curve','show'],i-1) || i==coords.length-1 && settings.main.show){
                    strokeStyle = i==coords.length-1?settings.main.color:get(['curve','color'],i-1)
                    lineWidth = i==coords.length-1?settings.main.width:get(['curve','width'],i-1)
                    beginPath()
                    moveTo.apply(c,b[i][j](0))
                    for(var k=0;k<=t*settings.sample;k++) lineTo.apply(c,b[i][j](k/settings.sample))
                    stroke()
                }
                if(i && i!=coords.length-1 && get(['guide','show'],i)){
                    strokeStyle = i==coords.length-1?settings.main.color:get(['guide','color'],i)
                    lineWidth = i==coords.length-1?settings.main.width:get(['guide','width'],i)
                    beginPath()
                    if(i!=coords.length-1) arc.apply(c,b[i][j](t).concat([settings.curve.width[0]/2,0,2*Math.PI]))
                    stroke()
                }
            }
            if(i && i!=coords.length-1 && get(['guide','show'],i)){
                beginPath()
                moveTo.apply(c,b[i][0](t))
                for(var j=1;j<coords.length-i;j++) lineTo.apply(c,b[i][j](t))
                stroke()
            }
        }
    }
    return b
}

function animateConstruction(coords){
    var s = settings.steps
    var cur = ($('t').value==1 ? ($('t').value=$('T').innerHTML=(0).toFixed(3))*1 : $('t').value*s)+1
    var b = drawConstruction(coords,$('t').value*1)
    itv = setInterval(function(){
        $("T").innerHTML = ($("t").value = cur/s).toFixed(3)
        drawConstruction(coords,cur++/s,b)
        if(cur>s) clearInterval(itv)
    },settings.stepTime)
}
//============================================
function draw(coords,t){clearInterval(itv); return window['draw'+settings.mode](coords,t)}
function animate(coords){clearInterval(itv); return window['animate'+settings.mode](coords);}
//============================================
function $(id){return document.getElementById(id)}
function v(o,p){
    for(var i in o){
        var k = (p||[]).concat([i]).join('-')
        var t
        if((t = o[i].constructor) == Object || t == Array) v(o[i],[k])
        else if(t = $(k)){
            if(t.type=='checkbox') t.checked = o[i]
            else if(t.type=='radio'){
                for(var j=0, t=document.getElementsByName(t.name); j<t.length; j++) if(t[j].value == o[i]){
                    t[j].checked = true
                    break
                }
            }else t.value = o[i]
        }else if(t = $((i==0?'x':'y') + p[0].slice(-1))) t.value = o[i]
    }
}

document.addEventListener('load',function(){
    v(settings)
    $('t').setAttribute('step',1/settings.steps)
    var t = document.getElementsByTagName('input')
    for(i=0;i<t.length;i++) t[i].addEventListener('change',function(){
        var t
        if((t=this.id.split('-')).length > 1){
            var t1 = function(T){
                var t = 'settings'
                T.forEach(function(e){t += '[' + (isNaN(e)?'"'+e+'"':e) +']'})
                eval(t + '=' + (this.type=='text'?this.value:(this.type=='checkbox'?this.checked:'"'+this.value+'"')))
                $(T.join('-')).value = this.value
            }
            t1.call(this,t)
            if(t[0]=='curve' && t[1]=='color' && $('u').checked==true) t1.call(this,['guide'].concat(t.slice(1)))
        }else if(this.id == 'u'){
            for(i=0;t=$('guide-color-'+i);i++){
                t.disabled = this.checked
                t.value = settings.guide.color[i] = this.checked?settings.curve.color[i]:t.value
            }
        }else if(this.id == 't'){
            $('T').innerHTML = (this.value*1).toFixed(3)
            draw(settings.coords,this.value*1)
        }else if(t = /([xy])(\d+)/.exec(this.id)) settings.coords[t[2]*1][t[1]=='x'?0:1] = this.value*1
        else settings[this.id] = this.value
        if(this.id == 'steps') $("t").setAttribute("step",1/settings.steps)
    },true)
},true)
</script>
</head>
<body>
<canvas style='float:left' width='510' height='510' id='c'>
</canvas>
<div style='padding-left:550px; font-family:Arial'>
<span class='h' style='width:123px'>Control Points</span><br />
(<input type='text' id='x0' size='3' maxlength='3' />,<input type='text' id='y0' size='3' maxlength='3' />)<br />
(<input type='text' id='x1' size='3' maxlength='3' />,<input type='text' id='y1' size='3' maxlength='3' />)<br />
(<input type='text' id='x2' size='3' maxlength='3' />,<input type='text' id='y2' size='3' maxlength='3' />)<br />
(<input type='text' id='x3' size='3' maxlength='3' />,<input type='text' id='y3' size='3' maxlength='3' />)<br /><br />
<span class='h' style='width:200px'>Appearance</span><br />
<span style='font-weight:bold'>Guide lines</span><br />
<input type='checkbox' checked='checked' id='u' onchange='' /> Use curve colors<br />
<table style='border-collapse:collapse'>
<tr><td><input type='checkbox' id='guide-show-0' /></td><td><input type='color' id='guide-color-0' disabled='disabled' /></td><td class='t'>Frame</td><td><input type='text' id='guide-width-0' size='2' maxlength='2' /></td></tr>
<tr><td><input type='checkbox' id='guide-show-1' /></td><td><input type='color' id='guide-color-1' disabled='disabled' /></td><td class='t'>1</td><td><input type='text' id='guide-width-1' size='2' maxlength='2' /></td></tr>
<tr><td><input type='checkbox' id='guide-show-2' /></td><td><input type='color' id='guide-color-2' disabled='disabled' /></td><td class='t'>2</td><td><input type='text' id='guide-width-2' size='2' maxlength='2' /></td></tr>
<tr><td><input type='checkbox' id='guide-show-3' /></td><td><input type='color' id='guide-color-3' disabled='disabled' /></td><td class='t'>3</td><td><input type='text' id='guide-width-3' size='2' maxlength='2' /></td></tr>
</table>
<span style='font-weight:bold'>Curves</span>
<table style='border-collapse:collapse'>
<tr><td><input type='checkbox' id='curve-show-0' /></td><td><input type='color' id='curve-color-0' /></td><td class='t'>1</td><td><input type='text' id='curve-width-0' size='2' maxlength='2' /></td></td></tr>
<tr><td><input type='checkbox' id='curve-show-1' /></td><td><input type='color' id='curve-color-1' /></td><td class='t'>2</td><td><input type='text' id='curve-width-1' size='2' maxlength='2' /></td></td></tr>
<tr><td><input type='checkbox' id='curve-show-2' /></td><td><input type='color' id='curve-color-2' /></td><td class='t'>3</td><td><input type='text' id='curve-width-2' size='2' maxlength='2' /></td></td></tr>
<tr><td><input type='checkbox' id='curve-show-3' /></td><td><input type='color' id='curve-color-3' /></td><td class='t'>4</td><td><input type='text' id='curve-width-3' size='2' maxlength='2' /></td></td></tr>
<tr><td><input type='checkbox' id='main-show' /></td><td><input type='color' id='main-color' /></td><td class='t'>Main</td><td><input type='text' id='main-width' size='2' maxlength='2' /></td></td></tr>
</table><br />
<span class='h' style='width:300px'>Graphing & Animation</span><br />
<table class>
<tr><td>Sample points:</td><td><input type='text' id='sample' /></td></tr>
<tr><td>Animation steps:</td><td><input type='text' id='steps' /></td></tr>
<tr><td>Step time:</td><td><input type='text' id='stepTime' />ms</td></tr>
</table>
<div style='position:absolute; top:526px; left:8px; width:510px; height:100px;'>
<input type='range' id='t' max='1' min='0' style='width:450px' value='1' />&nbsp;&nbsp;&nbsp;<span id='T' style='vertical-align: 6px'>1.000</span><br />
<input type='button' onclick='draw(settings.coords,$("t").value*1)' value='Draw' /><input type='button' onclick='animate(settings.coords)' value='Animate' />
<input type='radio' id='mode' name='mode' value='Bezier' />Basic Mode <input type='radio' id='mode' name='mode' value='Construction' />Construction Mode
</div>
</body>
</html>

TwiNight

Posted 2014-02-17T18:41:33.367

Reputation: 4 187

You should make this jsfiddle compatible so it could be tested easily. Good solution, although I couldn't set the control points in Chrome. – SztupY – 2014-02-20T09:34:25.107

@SztupY Added the fiddle

– TwiNight – 2014-02-23T05:10:06.107

6

Perl + PerlMagick

use strict;
use Image::Magick;

sub point
{
    my ($image, $f, $x, $y, $r) = @_;
    $image->Draw(fill => $f, primitive => 'circle', points => $x . ',' . $y . ',' . ($x + $r) . ',' . $y);
}

sub line
{
    my ($image, $f, $x1, $y1, $x2, $y2, $w) = @_;
    $image->Draw(fill => 'transparent', stroke => $f, primitive => 'line', strokewidth => $w, points => "$x1,$y1,$x2,$y2");
}

sub colorize
{
    my $i = shift;
    return ((sin($i * 6) + 0.5) * 255) . ',' . ((sin($i * 6 + 2) + 0.5) * 255) . ',' . ((sin($i * 6 + 4) + 0.5) * 255);
}

sub eval_bezier
{
    my $p = shift;
    my @x = @_;
    my @y;
    for my $i (0 .. $#x - 1)
    {
        $y[$i] = $x[$i] * (1 - $p) + $x[$i + 1] * $p;
    }
    return @y;
}

sub render_bezier
{
    my (%args) = @_;
    my $seq = $args{sequence};
    for my $q (0 .. $args{frames} - 1)
    {
        my $p = $q / ($args{frames} - 1);
        my @x = @{$args{xpoints}};
        my @y = @{$args{ypoints}};
        my $amt = @x;
        my $image = Image::Magick->new(size => $args{size});
        $image->ReadImage('xc:black');
        for my $i (0 .. $amt - 1)
        {
            for my $j (0 .. $#x - 1)
            {
                line($image, 'rgba(' . (colorize $i / $amt). ', 0.5)', $x[$j], $y[$j], $x[$j+1], $y[$j+1], 4 * 0.88 ** $i)
            }
            for my $j (0 .. $#x)
            {
                point($image, 'rgba(' . (colorize $i / $amt). ', 1.0)', $x[$j], $y[$j], 4 * 0.88 ** $i);
            }
            @x = eval_bezier $p, @x;
            @y = eval_bezier $p, @y;
        }
        my ($ox, $oy) = ($x[0], $y[0]);
        for my $q (0 .. $q)
        {
            my $p = $q / ($args{frames} - 1);
            my @x = @{$args{xpoints}};
            my @y = @{$args{ypoints}};
            for (0 .. $amt - 2)
            {
                @x = eval_bezier $p, @x;
                @y = eval_bezier $p, @y;
            }
            line($image, 'rgba(255, 255, 255, 1.0)', $x[0], $y[0], $ox, $oy, 2);
            ($ox, $oy) = ($x[0], $y[0]);
        }
        push @$seq, $image;
    }
}

my @x = (10,190,40,190);
my @y = (190,30,10,110);

my $gif = Image::Magick->new;
render_bezier(xpoints => \@x, ypoints => \@y, sequence => $gif, size => '200x200', frames => 70);
$gif->Write(filename => 'output.gif');

Example of output:

Other outputs can be seen in this imgur album

mniip

Posted 2014-02-17T18:41:33.367

Reputation: 9 396