The strange attraction of the logistic map

21

1

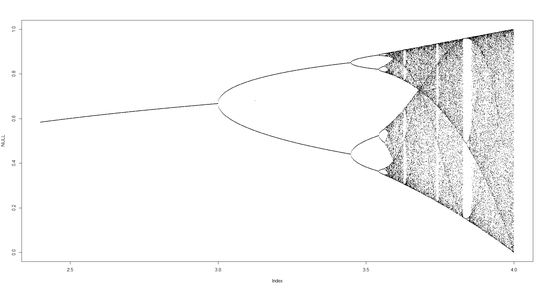
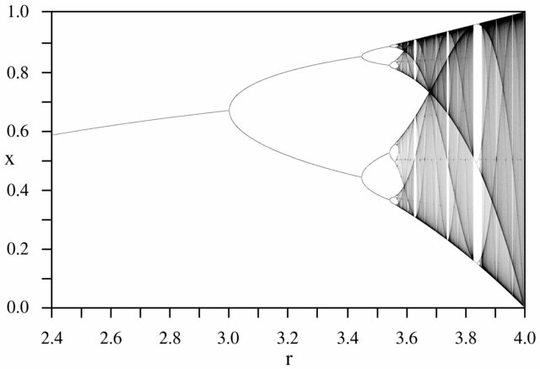
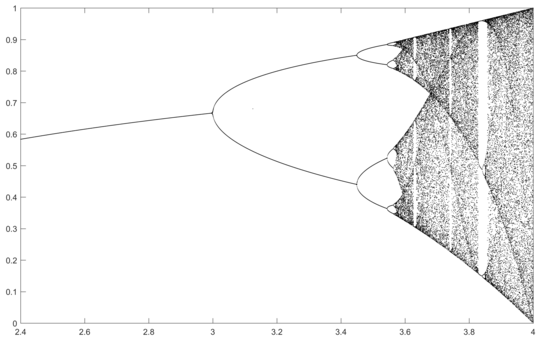
The purpose of the challenge is to approximately plot the attractor of the logistic map as a function of its parameter r (also called bifurcation diagram), or a subregion of it. The appearance of the graph can be seen in the following image from Wikipedia:

enter image description here

Background

The logistic map is a mathematical function that takes an input xk and maps it to an output xk+1 defined as

             xk+1 = r xk (1−xk)

where r is the parameter of the map, assumed to lie in the interval [0, 4].

Given r in [0,4], and an initial value x0 in the interval [0,1], it is interesting to repeatedly apply the function for a large number N of iterations, producing a final value xN. Note that xN will necessarily lie in [0,1] too.

As an example, consider r = 3.2, N = 1000. The initial value x0 = 0.01 gives x1000 = 0.5130. For x0 = 0.02 the result is x0 = 0.7995. For any other initial values x0 the final values x1000 are extremely close to either 0.5130 or 0.7995. This is seen in the graph as the height of the two lines at horizontal position r = 3.2.

This does not mean that for r = 3.2 each sequence converges to one of those two values. In fact, for the two initial values considered above, the sequences are (note the oscillating behaviour):

             x0 = 0.01, ..., x1000 = 0.5130, x1001 = 0.7995, x1002 = 0.5130, ...
             x0 = 0.02, ..., x1000 = 0.7995, x1001 = 0.5130, x1002 = 0.7995, ...

What is true is that for sufficiently large N, and for almost all initial values x0, the term xN will be close to one of the elements of the set {0.5130, 0.7995}. This set is called the attractor for this specific r.

For other values of the parameter r the size of the atractor set, or its elements, will change. The graph plots the elements in the attractor for each r.

The attractor for a specific r can be estimated by

  1. testing a wide range of initial values x0;
  2. letting the system evolve for a large number N of iterations; and
  3. taking note of the final values xN that are obtained.

The challenge

Inputs

  • N: number of iterations.

  • r1, r2 and s. These define the set R of values of r, namely R = {r1, r1 + s, r1 + 2 s, ..., r2}.

Procedure

The set X of initial values x0 is fixed: X = {0.01, 0.02, ..., 0,99}. Optionally, 0 and 1 may also be included in X.

For each r in R and each x0 in X, iterate the logistic map N times to produce xN. Record the obtained tuples (r, xN).

Output

Plot each tuple (r, xN) as a point in the plane with r as horizontal axis and xN as vertical axis. Output should be graphic (not ASCII art).

Additional rules

  • The indicated procedure defines the required result, but is not enforced. Any other procedure that procudes the same set of (r, xN) tuples can be used.
  • Input is flexible as usual.
  • Floating point errors won't be held against the answerer.
  • Graphic output is required, in any of the accepted formats. In particular, output may be displayed on screen, or a graphics file may be produced, or an array of RGB values may be output. If outputting a file or an array, please post an example of what it looks like when displayed.
  • Graphics may be vector or raster. For raster graphics, the size of the image should be at least 400×400 pixels.
  • Each point should be shown as a single pixel, or as a mark with size of the order of one pixel (otherwise the graph quickly gets cluttered).
  • Axis range should be [0,4] for r (horizontal axis) and [0,1] for xN (vertical axis); or it may be smaller as long as it includes all obtained points.
  • Axis scales are arbitrary. In particular, the scale need not be the same for both axes.
  • Grid lines, axis labels, colors and similar elements are acceptable, but not required.
  • Shortest code in bytes wins.

Test cases

Click on each image for a high-resolution version.

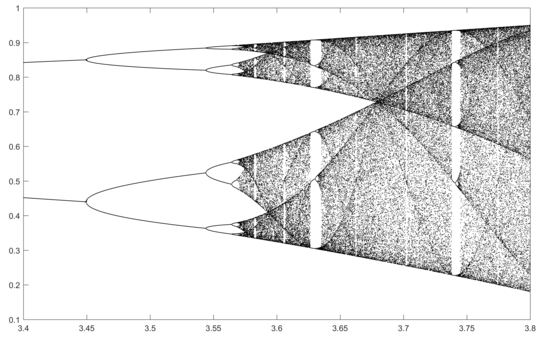
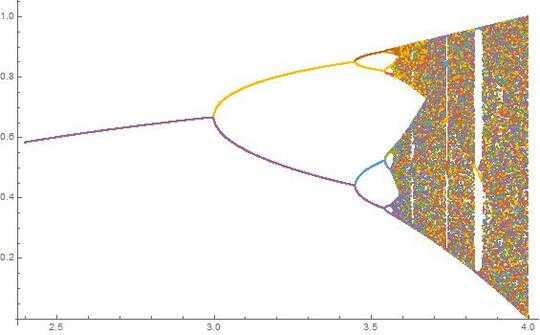
N = 1000; r1 = 2.4; r2 = 4; s = 0.001;

enter image description here

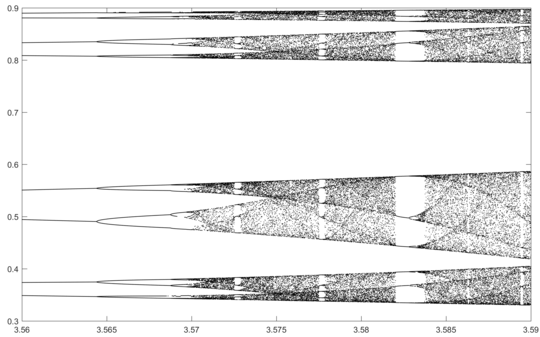
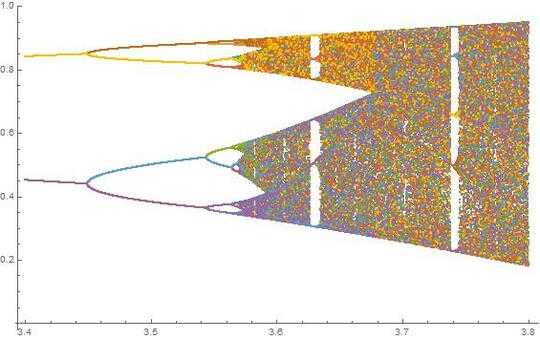
N = 2000; r1 = 3.4; r2 = 3.8; s = 0.0002;

enter image description here

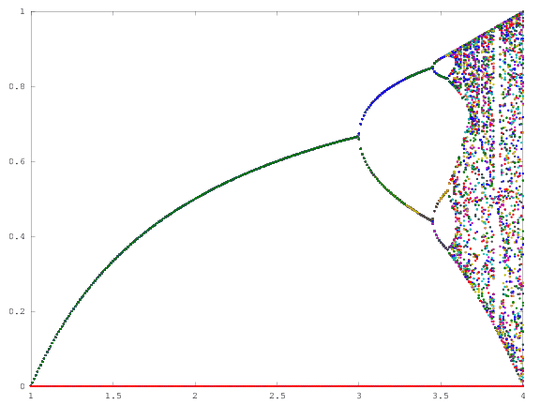
N = 10000; r1 = 3.56; r2 = 3.59; s = 0.00002;

enter image description here

Acknowledgment

Thanks to @FryAmTheEggman and @AndrasDeak for their helpful comments while the challenge was in the sandbox.
Luis Mendo

Posted 2017-05-29T14:34:01.477

Reputation: 87 464

What no python solution?! – None – 2017-06-26T05:35:37.283

@Lembik I have a reference implementation in Python (and in Matlab), but I don't want to answer myself – Luis Mendo – 2017-06-26T07:34:16.043

You are allowed to answer your own questions on PPCG (perhaps surprisingly). – None – 2017-06-26T07:35:03.427

@Lembik I know, but I'd rather have others' answers – Luis Mendo – 2017-06-26T07:36:33.663

Answers

13

MATL, 32 30 28 27 bytes

4 bytes saved thanks to @Luis

3$:0:.01:1!i:"tU-y*]'.'3$XG

The input format is r1, s, r2, and N

Try it at MATL Online

enter image description here

Explanation

        % Implicitly grab the first three inputs
3$:     % Take these three inputs and create the array [r1, r1+s, ...]
0:.01:1 % [0, 0.01, 0.02, ... 1]
!       % Transpose this array
i       % Implicitly grab the input, N
:"      % For each iteration
  tU    % Duplicate and square the X matrix
  -     % Subtract from the X matrix (X - X^2) == x * (1 - x)
  y     % Make a copy of R array
  *     % Multiply the R array by the (X - X^2) matrix to yield the new X matrix
]       % End of for loop
'.'    % Push the string literal '.' to the stack (specifies that we want
        % dots as markers)
3$XG    % Call the 3-input version of PLOT to create the dot plot

Suever

Posted 2017-05-29T14:34:01.477

Reputation: 10 257

8

Mathematica, 65 bytes

Graphics@Table[Point@{r,Nest[r#(1-#)&,x,#]},{x,0,1,.01},{r,##2}]&

Pure function taking the arguments N, r1, r2, s in that order. Nest[r#(1-#)&,x,N] iterates the logistic function r#(1-#)& a total of N times starting at x; here the first argument to the function (#) is the N in question; Point@{r,...} produces a Point that Graphics will be happy to plot. Table[...,{x,0,1,.01},{r,##2}] creates a whole bunch of these points, with the x value running from 0 to 1 in increments of .01; the ##2 in {r,##2} denotes all of the original function arguments starting from the second one, and so {r,##2} expands to {r,r1,r2,s} which correctly sets the range and increment for r.

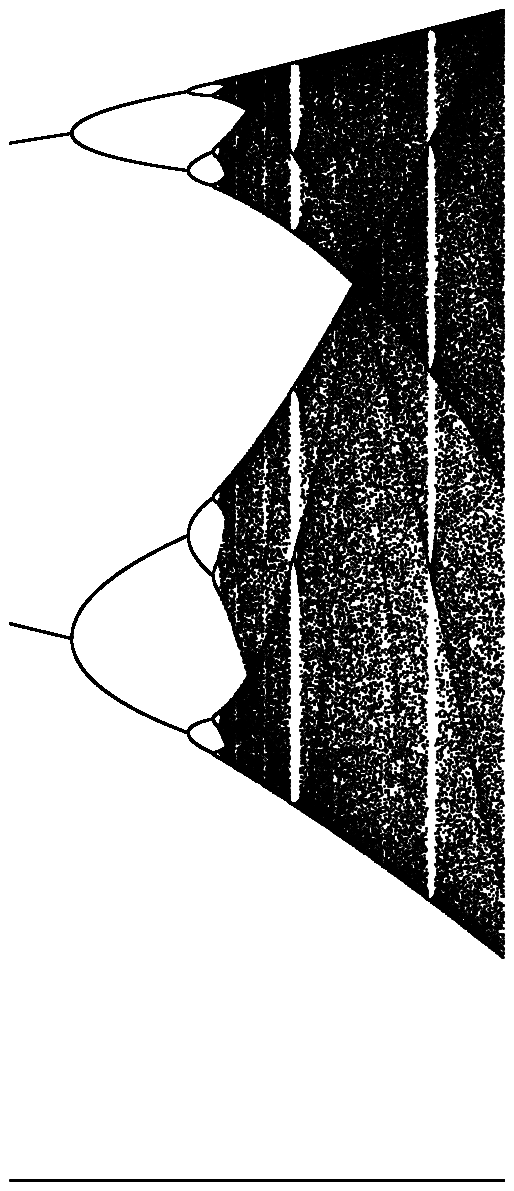
Sample output, on the second test case: the input

Graphics@Table[Point@{r,Nest[r#(1-#)&,x,#]},{x,0,1,.01},{r,##2}]&[2000,3.4,3.8,0.0002]

yields the graphics below.

enter image description here

Greg Martin

Posted 2017-05-29T14:34:01.477

Reputation: 13 940

159 bytes ListPlot@Table[{r,Nest[r#(1-#)&,x,#]},{x,0,1,.01},{r,##2}]& – J42161217 – 2017-05-29T23:22:10.803

I've clarified in the challenge that the indicated procedure is meant to define the required result, but the procedure itself is not enforced. You can use any other procedure that gives the same result. Sorry if that wasn't clear at first – Luis Mendo – 2017-05-30T09:54:17.607

Not a problem, we have several good answers! – Greg Martin – 2017-05-30T10:07:58.417

1Aren't you going to use those -6 bytes. Do you think that somathing is wrong with this solution? – J42161217 – 2017-05-30T14:11:39.837

Oh I thought your answer was the posting of (a version of) the code from your comment.... – Greg Martin – 2017-05-30T19:50:10.107

5

Mathematica, 65 bytes

I used some of Greg Martin's tricks and this is my version without using Graphics

ListPlot@Table[{r,NestList[#(1-#)r&,.5,#][[-i]]},{i,99},{r,##2}]&

input

[1000, 2.4, 4, 0.001]

output

enter image description here

input

[2000, 3.4, 3.8, 0.0002]

output

enter image description here

J42161217

Posted 2017-05-29T14:34:01.477

Reputation: 15 931

1First answer that chooses to avoid initial values 0 or 1 (and the x = 0 line they generate) :-) – Luis Mendo – 2017-05-29T21:53:27.987

You should add an explanation of what your code does, since it doesn't actually follow the specified procedure. The OP can decide whether the accurate-looking result justifies the alternate method. – Greg Martin – 2017-05-30T02:25:10.447

The specified procedure is not enforced. Anything that gives the same result, by any other means, is allowed (I'll clarify that). Regardless of this, I'm curious to see the explanation – Luis Mendo – 2017-05-30T09:49:01.313

The points that you need to plot for every r, exist already in every "Nest". this is original code and it was my first approach (a while ago) on plotting this diagram. – J42161217 – 2017-05-30T14:09:11.513

@Luis Mendo I have an even shorter version (which makes a record for mathematica).58 bytes but you must enter only 3 inputs [N,r1,r2].It takes time but it works.Plot[Table[NestList[#(1-#)r&,.5,#][[-i]],{i,99}],{r,##2}]& – J42161217 – 2017-05-30T14:22:49.077

So the step s would be fixed? It would not be valid then – Luis Mendo – 2017-05-30T14:26:20.140

no it is not. the step changes into the nest – J42161217 – 2017-05-30T16:28:04.540

I don't get what you mean by "nest". Anyway, if you don't take the step as input, how can the code take the step into account? – Luis Mendo – 2017-05-30T18:33:58.317

"Plot" in mathimatica takes automatically a tiny step... Like when you plot sin(x),{x,0,2pi} on the Reals. This automatic tiny step gives me the extra bytes in my second code.Problem is the step is very small and it takes much time – J42161217 – 2017-05-30T18:44:29.073

2

TI-Basic, 85 bytes

Prompt P,Q,S,N
P→Xmin:Q→Xmax
0→Ymin:1→Ymax
For(W,.01,1,.01
For(R,P,Q,S
W→X
For(U,1,N
R*X*(1-X→X
End
Pt-On(R,X
End
End

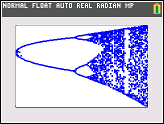
A complete TI-Basic program which takes input in the order r1,r2,s,N and then shows the output in real time on the graph screen. Note that this tends to be incredibly slow.

Here is an incomplete sample output generated after about 2.5 hours for the input 3,4,0.01,100:

enter image description here

R. Kap

Posted 2017-05-29T14:34:01.477

Reputation: 4 730

You don't need the * signs. – lirtosiast – 2017-08-25T00:31:30.573

1

ProcessingJS, 125 123 120 bytes

Thanks to Kritixi Lithos for saving 3 bytes.

var f(n,q,r,s){size(4e3,1e3);for(i=0;i<1;i+=.01)for(p=q;p<=r;p+=s){x=i;for(j=0;j<n;j++)x*=p-p*x;point(p*1e3,1e3-x*1e3)}}

Try it online! Call using f(N, r_1, r_2, s);

ASCII-only

Posted 2017-05-29T14:34:01.477

Reputation: 4 687

I think you can replace void with var because it's ProcessingJS – user41805 – 2017-06-20T09:34:19.407

And x*=p*(1-x) can become x*=p-p*x – user41805 – 2017-06-20T09:37:49.070

By rearranging the for-loop, I get var f(n,q,r,s){size(4e3,1e3);for(i=0;i<1;i+=.01)for(p=q;x=i,p<=r;point(p*1e3,1e3-x*1e3),p+=s)for(j=0;j<n;j++)x*=p-p*x;} at 119 bytes – user41805 – 2017-06-24T07:31:16.077

1

GEL, 158 bytes

`(N,r,t,s)=(LinePlotWindow=[r,t,0,1];for i=r to t by s do(p=.;for w=0to 1by 0.01do(x=w;for a=0to N do(x=i*x*(1-x););p=[p;q=[i,x]];);LinePlotDrawPoints(p);););

It may not be the shortest, but it draws in real time, although it can be incredibly slow with huge inputs. Anyways, this is an anonymous function which takes input in the format (N,r1,r2,s) and outputs the plot in a new window. Note that this must be run with the GNOME version of Genius.

Sample output

R. Kap

Posted 2017-05-29T14:34:01.477

Reputation: 4 730

1

R, 159 147 bytes

pryr::f({plot(NA,xlim=c(a,b),ylim=0:1);q=function(r,n,x=1:99/100){for(i in 1:n)x=r*x*(1-x);x};for(i in seq(a,b,s))points(rep(i,99),q(i,n),cex=.1)})

Which productes the function

function (a, b, n, s) 
{
    plot(NA, xlim = c(a, b), ylim = 0:1)
    q = function(r, n, x = 1:99/100) {
        for (i in 1:n) x = r * x * (1 - x)
        x
    }
    for (i in seq(a, b, s)) points(rep(i, 99), q(i, n), cex = 0.1)
}

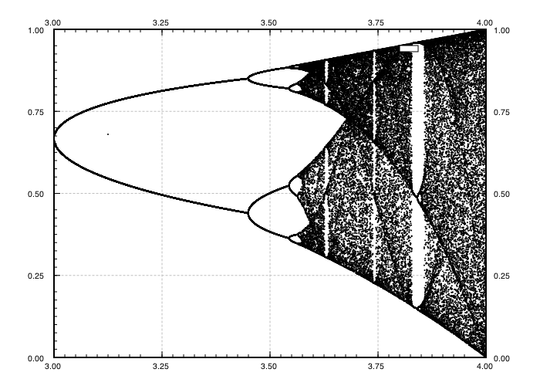
plot(NA,...) creates an empty canvas that has the correct dimensions. q is the function that does the iterating. It takes a value of r, and then does n iterations for all starting points between 0.01 and 0.99. It then returns the resulting vector.

The for-loop applies the function q to the sequence a to b with step s. Instead of returning the values, it adds them as points to the plot. If the attraction point is one value, all the points would just overlap and show as one point. cex=.1 is a necessary addition to make the points as small as possible.

enter image description here

JAD

Posted 2017-05-29T14:34:01.477

Reputation: 2 898