10
4
The goal of a Rosetta Stone Challenge is to write solutions in as many languages as possible. Show off your programming multilingualism!
The Challenge
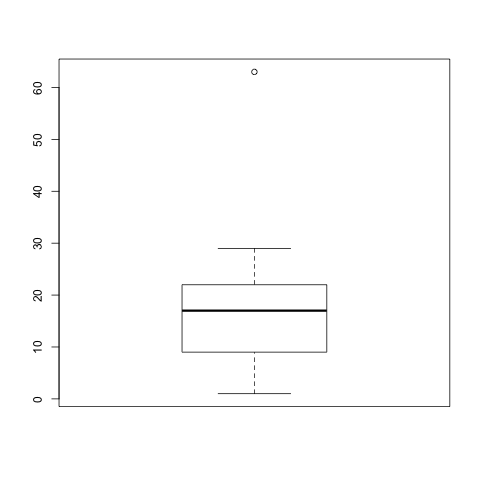
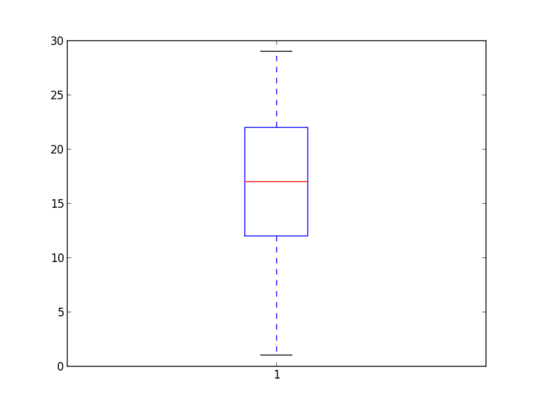
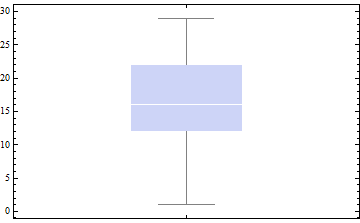
Your challenge is to implement a program that will input a list of numbers and output a box plot of the data, in as many programming languages as possible. The box plot will display the quartiles and outliers in the data, and it will even have a scale. You are allowed to use any sort of standard library function that your language has, since this is mostly a language showcase.
What is a "box plot?"
A box plot is a way of graphing data. A box plot has a few essential features. The first feature is a box, with either side being located at the first and third quartiles of the data. There is a line down the center of the box plot that gives the median. On either end of the box plot, there are "whiskers" that help show the variance of the data. The whisker extends from the box to the least and greatest points in the data set, excluding the outliers. The outliers are plotted as individual points.
First, take the median of the data. Then, take all of the data points that are strictly less than the median, and compute the median of this set to become the first quartile (Q1). Take all of the data points that are strictly greater than the median, and compute the median of this set to become the third quartile (Q3). Find the value of R = 1.5*(Q3 - Q1). Any numbers less Q1 - R this are outliers. Any numbers greater than Q3 + R are outliers. Take the set of all data points that are not outliers, and the minimum and maximum of this set determines the ends of the two whiskers.
Input
Input will begin with n= followed by a number. There will then be n numbers, one per line. All of the numbers will be integers from 0 to 63, inclusive.
n=8
29
1
22
18
12
16
16
22
Output
Output will be a rendition of the box plot. One possible way to draw the plot is by rendering it in ASCII. You can render the box plot in many ways other than ASCII, but the main requirement is that drawn large enough so that it is possible to tell the exact locations of the important features. The box plot should have a scale, consisting of around 5-10 numbers equally spaced. Here is one example plot of the above data:
              +--+----+
              |  |    |
 X          +-+  |    +------+
              |  |    |
              +--+----+

0    0    1    1    2    2    3
0    5    0    5    0    5    0
The Objective Winning Criterion
As for an objective winning criterion, here it is: Each language is a separate competition as to who can write the shortest entry, but the overall winner would be the person who wins the most of these sub-competitions. This means that a person who answers in many uncommon languages can gain an advantage. Code-golf is mostly a tiebreaker for when there is more than one solution in a language: the person with the shortest program gets credit for that language.
Rules, Restrictions, and Notes
Your program can be written in any language that existed prior to April 11th, 2013. I will also have to rely on the community to validate some responses written in some of the more uncommon/esoteric languages, since I am unlikely to be able to test them.
Current Leaderboard
This section will be periodically updated to show the number of languages and who is leading in each.
- Julia (604) - plannapus
- Mathematica (71) - chyanog
- Python2.X (85) - Abhijit
- R (34) - plannapus
Current User Rankings
- plannapus - 2
- Abhijit - 1
- chyanog - 1

PhiNotPi
Posted 2013-04-11T23:13:17.793
Reputation: 26 739


2I love it! A very nice configuration of rules. Now to learn some languages ... – luser droog – 2013-04-12T04:18:44.597