Tension on a Graph, Part I: A Wavy String

21

2

Let's plot a function f(x) = sin(πx) + 0.5 sin(3πx) over the domain [-3,3]. We can interpret this as a loose string lying on a board. Now let's drive n nails into the board at positions (x1, y1) to (xn, yn), where the xi ∈ (-3,3) and yi ∈ [-1,1]. Imagine that there are two eyelets at the end of the string, that is at positions (-3,0) and (3,0). We can now take the ends of string and pull the through the eyelets until the string is taut. This will deform our graph into a piecewise linear function.

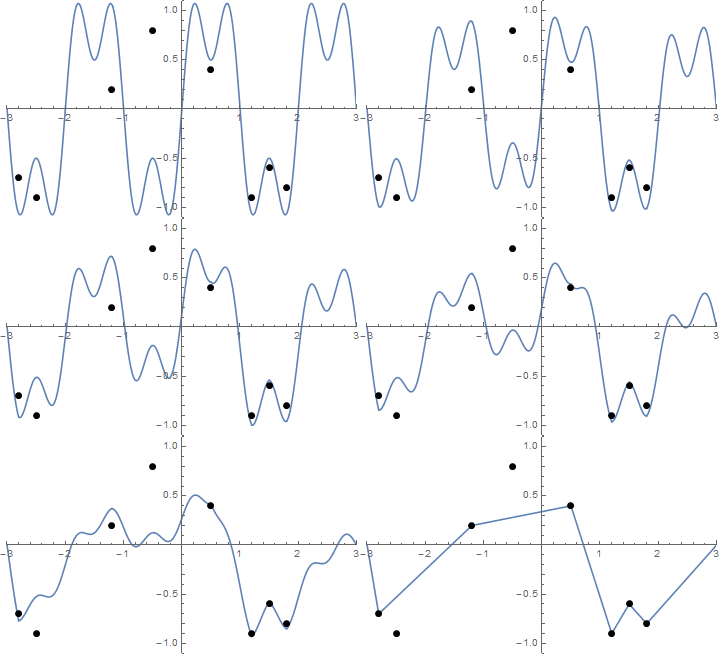
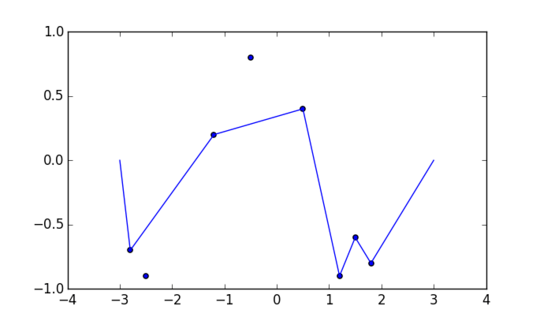
Some pictures might help. Take 8 nails at (-2.8, -0.7), (-2.5, -0.9), (-1.2, .2), (-0.5, .8), (0.5, .4), (1.2, -0.9), (1.5, -0.6), (1.8, -0.8). The following three plots show the process described above:

enter image description here

For larger version: Right-click --> Open in new tab

And here is an animation of the string tightening if you have some difficulty visualising it:
enter image description here

The Challenge

Given a list of "nails" (which is not necessarily sorted), plot those nails and the taut string if it starts from the shape of the above function f.

You may write a program or function and take input via STDIN, ARGV or function argument. You can either display the result on the screen or save an image to a file.

If the result is rasterised, it needs to be at least 300 pixels wide and 100 pixels tall. The coordinate range from (-3,-1.1) to (3,1.1) must cover at least 75% of the horizontal and vertical extent of the image. The length scales of x and y do not have to be the same. You need to show the nails (using at least 3x3 pixels) and the string (at least 1 pixel wide). You may or may not include the axes.

Colours are your choice, but you need at least two distinguishable colours: one for the background and one for the nails and the string (those may have different colours though).

You may assume that all nails are at least 10-5 units away from f (so that you don't need to worry about floating-point inaccuracy).

This is code golf, so the shortest answer (in bytes) wins.

More Examples

Here are two more (simpler) examples:

{{-2.5, 1}, {-1.5, -1}, {-0.5, 1}, {0.5, -1}, {1.5, 1}, {2.5, -1}}
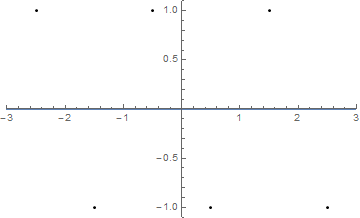
enter image description here

(The string coincides with the x-axis.)

{{-2.7, -0.5}, {-2.3, -0.5}, {-1.7, 0.5}, {-1.3, 0.5}, {-0.7, -0.5}, {-0.3, -0.5}, {0.5, 1}, {1.5, -1}, {2.5, 1}}
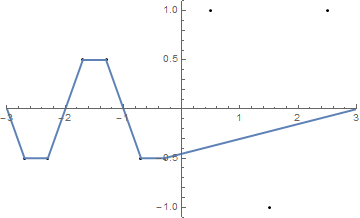
enter image description here

Want another Challenge?

Here is Part II!

Martin Ender

Posted 2014-09-29T15:13:51.257

Reputation: 184 808

Can we assume that the nails are sorted from left to right? – Ell – 2014-09-30T07:26:03.127

@Ell Ah, good catch. Since I haven't specified it to begin with, no. I'll clarify that. – Martin Ender – 2014-09-30T07:40:28.450

Answers

8

Python + Pycairo, 727 708 608, + PyLab, 383

from pylab import*
def f(N):
 def P(u,w,N):
    T=lambda v,p:(C(v-u,p-u)>0)==(C(w-v,p-v)>0)==(C(u-w,p-w)>0);M=[(i,n)for i,n in enumerate(N)if T(V([n[0],sin(pi*n[0])+sin(3*pi*n[0])/2]),n)]
    if M:i,n=max(M,key=lambda n:C(n[1]-u,w-u)**2);M=P(u,n,N[:i])+[n]+P(n,w,N[i+1:])
    return M
 V=array;C=cross;a=V([3,0]);plot(*zip(*([-a]+P(-a,a,map(V,sorted(N)))+[a])));N and scatter(*zip(*N));show()

Example

f([(-2.8,-0.7),(-2.5,-0.9),(-1.2,0.2),(-0.5,0.8),(0.5,0.4),(1.2,-0.9),(1.5, -0.6),(1.8, -0.8)])

Example 1

How it works

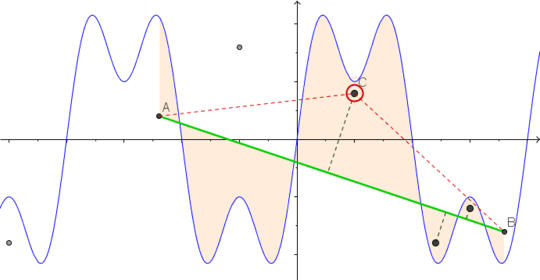
Suppose we know that the taut string passes through two points A and B (we can always start with
A = (-3, 0) and B = (3, 0).) As we pull the string, it "wants" to take the shortest path possible between A and B, that is, ideally, the segment AB. However, if there are any nails in the area bounded by the function (sin πx + ...) and AB, then at least one of them must block the string. In particular, the nail(s) farthest away from AB within the said area must block the string. Hence, if C is this nail, we know that the taut string must pass through C, in addition to A and B. We can now repeat the process for the segments AC and CB, and continue in this fashion until eventually there are no more intervening nails. Figure 1

This is a binary divide-and-conquer algorithm with a linear scan in each step, so it has a best-case complexity of O(n log n) and worst-case complexity of O(n2).

Ell

Posted 2014-09-29T15:13:51.257

Reputation: 7 317

It errors if the list of points is empty. But other than that mine is obviously hopeless! – feersum – 2014-09-30T10:46:42.533

@feersum Good catch. Fixed. – Ell – 2014-09-30T12:23:33.797

3

Python + pylab, 576 bytes

Algorithm:

I interpreted the problem as finding the shortest path from (-3, 0) to (3, 0) such that a vertical line segment connecting a point on the path to a point on f(x) never crosses a nail.

At each x where exists at least one nail, find the least upper bound and greatest lower bound given by the nails at that x. Consider the points given by these bounds plus the starting and ending points to be the vertices on a graph. Add an edge with weight given by the Euclidean distance between two vertices iff the line segment between them falls within the upper and lower bounds for each intervening x coordinate. Find the shortest path on this graph.

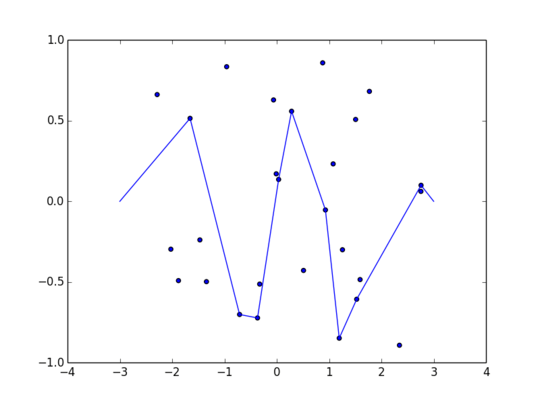
Example with 27 random points:

(-0.367534, -0.722751), (-0.710649, -0.701412), (1.593101, -0.484983), (1.771199, 0.681435), (-1.878764, -0.491436), (-0.061414, 0.628570), (-0.326483, -0.512950), (0.877878, 0.858527), (1.256189, -0.300032), (1.528120, -0.606809), (-1.343850, -0.497832), (1.078216, 0.232089), (0.930588, -0.053422), (-2.024330, -0.296681), (-2.286014, 0.661657), (-0.009816, 0.170528), (2.758464, 0.099447), (-0.957686, 0.834387), (0.511607, -0.428322), (-1.657128, 0.514400), (1.507602, 0.507458), (-1.469429, -0.239108), (0.035742, 0.135643), (1.194460, -0.848291), (2.345420, -0.892100), (2.755749, 0.061595), (0.283293, 0.558334), 

lame example

Golfed

What appears as several spaces of indentation in the for j in R(i&~1) loop should actually be a tab.

from pylab import*
P=((3,0),(-3,0))+input()
X=sorted(set(zip(*P)[0]))
l=len(X)*2
if l>4:scatter(*zip(*P[2:]))
f=lambda x:sin(pi*x)+sin(3*pi*x)/2
B=[[max([-9]+[p[1]for p in P if x==p[0]and p[1]<f(x)]),min([9]+[p[1]for p in P if x==p[0]and p[1]>f(x)])]for x in X]
b=zeros(l);b[2:]=inf
v=list(b)
R=range
for i in R(l):
 for j in R(i&~1):
    A=B[j/2][j&1];D,d=B[i/2][i&1]-A,X[i/2]-X[j/2];K=1;c=b[j]+norm((d,D))
    for k in R(j/2+1,i/2):C=A+D/d*(X[k]-X[j/2]);K&=C<B[k][1];K&=C>B[k][0]
    if(c<b[i])&K:b[i]=c;v[i]=j,(X[j/2],A)
l-=2
s=P[:1]
while l/2:l,p=v[l];s+=(p,)
plot(*zip(*s))
show()

Ungolfed

from pylab import*
P = input()
Xn,Yn = zip(*P)
X = set(Xn+(3,-3))
f = lambda x:sin(pi*x)+sin(3*pi*x)/2
ylb = {x: max([-9]+[p[1] for p in P if p[0] == x and p[1] < f(x)]) for x in X}
yub = {x: min([9]+[p[1] for p in P if p[0] == x and p[1] > f(x)]) for x in X}
ylb[-3] = yub[3] = ylb[3] = 0
X = sorted(X)
l = len(X)
best = zeros((l,2))
best[1:] = inf
prev = [ [0,0] for i in range(l) ]
for i in range(l): # calculate min path to X[i] lb or ub
  for ib in 0,1:
    for j in range(i): # point to come from
      for jb in 0,1:
          Y2, Y1 = (ylb, yub)[ib][X[i]], (ylb, yub)[jb][X[j]]
          dy,dx = Y2 - Y1, X[i] - X[j]
          if all([Y1 + dy/dx*(x - X[j]) < yub[x] and Y1 + dy/dx*(x - X[j]) > ylb[x] for x in X[j+1:i]]):
             c = best[j][jb] + (dy**2+dx**2)**.5
             if c < best[i][ib]:
                 best[i][ib] = c
                 prev[i][ib] = j, jb, (X[j], Y1)
j, jb = l-1,0
pts = [(3,0)]
while j:
    j, jb, p = prev[j][jb]
    pts += [p]
plot(*zip(*pts))
scatter(Xn,Yn)
show()

feersum

Posted 2014-09-29T15:13:51.257

Reputation: 29 566

PyLab was definitely a smarter choice :) – Ell – 2014-09-30T07:26:42.460